Reference no: EM132793224
GEOG2700 Geographical Data and Analysis - University of Lethbridge
short questions.
** Show how you could use a one-sample t test to check the accuracy of the statement "the parks around the outside of our city have an average area of 3 hectares", if the sizes of the 20 parks are below. The mean of these 20 parks is 2.67 hectares, with a standard deviation of 0.7678. You need to calculate standard error and then determine a t value to compare to the critical t in the table, which is 2.09. Interpret the results.
You can answer the problem without the data, but here it is, for clarity.
2.9, 2.9, 2.4, 2.1, 3.9, 3.2, 2.1, 1.1, 2.1, 3.4, 3.9, 2.5, 3.0, 3.2, 2.2, 3.0, 2.4, 2.4, 3.5, 1.2
1. Show the null hypothesis
2. Calculate the standard error and the test statistic t
The hypothesized value is 3.
Tcalc = X - μ0/s/√η
3. Decide to reject the null hypothesis or not.
4. Draw a conclusion in plain language.
** I showed this problem in a video and posted it in a pdf on Moodle, Feb 8, to help you. The data are counts of faecal coliform bacteria in water samples from two beaches. The researchers used a two-sample t test to test the hypothesis that the beaches are equally polluted. The means of the counts on the two beaches are 123.07 and 86.36, and the variances are 1037.46 and 1029.17. Perform atwo-sample t test. Calculate the sum of squared deviations for each beach. The critical t value is 2.06.
|
beach1
|
|
|
beach2
|
|
118
|
|
|
101
|
|
104
|
|
|
130
|
|
92
|
|
|
56
|
|
112
|
|
|
112
|
|
169
|
|
|
127
|
|
160
|
|
|
24
|
|
85
|
|
|
88
|
|
140
|
|
|
110
|
|
107
|
|
|
104
|
|
165
|
|
|
86
|
|
75
|
|
|
69
|
|
123
|
|
|
77
|
|
104
|
|
|
33
|
|
169
|
|
|
92
|
5. Calculate the SS for beach1: ______________
6. Calculate the SS for beach2: ______________
7. Calculate mean and variance for each sample. Do they match the answers above?
8. State the null hypothesis and say if we reject or not.
Sp2 = (n1-1)S12 + (n2-1)S22/(n1 + n2 -2)
Tcalc = X1‾ - X2‾ - d/SP√(1/η1 + 1/η2)
** A study of the grades that result from different teaching techniques was conducted. A geography class was divided into four groups by random selections. Geography course content was taught to students in the four groups, using four different methods. The teaching methods were #1, class videos only; #2, class videos plus group discussion; #3, online optional videos only; #4, class lectures followed by student discussion groups, then videos. Exam grades of the students were recorded. The four groups did not have equal numbers of students.
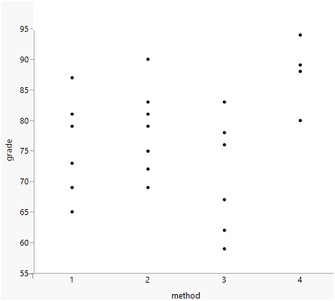
Data by Group
|
1
|
2
|
3
|
4
|
|
65
|
75
|
59
|
94
|
|
87
|
69
|
78
|
89
|
|
73
|
83
|
67
|
80
|
|
79
|
81
|
62
|
88
|
|
81
|
72
|
83
|
|
|
69
|
79
|
76
|
|
|
90
|
|
|
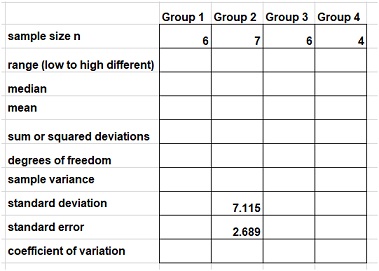
This section counts 34 points. Fill in the table below. Calculate these basic statistics and measures to complete the table. The sum of squared deviations is computed within each group, using the mean for that group.
One of the researchers rearranged the data into the columns below and entered it into SPSS. They applied "Analyze, Compare Means, One-way ANOVA".
|
method
|
grade
|
|
1
|
65
|
|
1
|
87
|
|
1
|
73
|
|
1
|
79
|
|
1
|
81
|
|
1
|
69
|
|
2
|
75
|
|
2
|
69
|
|
2
|
83
|
|
2
|
81
|
|
2
|
72
|
|
2
|
79
|
|
2
|
90
|
|
3
|
59
|
|
3
|
78
|
|
3
|
67
|
|
3
|
62
|
|
3
|
83
|
|
3
|
76
|
|
4
|
94
|
|
4
|
89
|
|
4
|
80
|
|
4
|
88
|
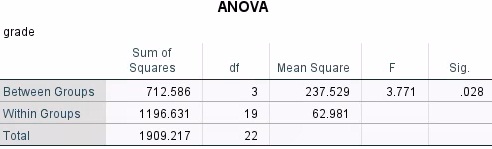
Interpret the results of the Analysis of Variance (SPSS)
Questions:
43. What is the null hypothesis?
44. How many students were in the study in total?
45. Show why "Within Groups" has 19 degrees of freedom.
46. Show how MS Between Groups was calculated.
47. Show how MS Within Groups was calculated.
48. Show how the F in the table was calculated.
49. What proportion of the total sum of squared deviations of the full dataset was accounted for by "Between Group" sum of squared deviations?
50. Should we reject the null hypothesis?
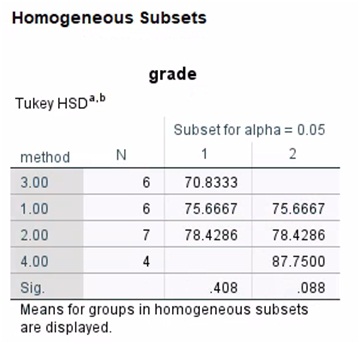
The researchers then performed the Post-Hoc test below. Which answers are true, or false (markT or F), regarding the mean grades of the teaching method groups?
51. #4 is significantly greater than all others.
52.#4 is significantly greater than all others and #3 is significantly lower.
53. #4 is significantly greater than #3.
54. All means in group A are significantly greater than all means in group B.
55. #4 and #2 are significantly greater than #1 and #3.
56. The ANOVA should be re-run with two factors.
Here is another way to display the results.
Post-hoc tests. Tukey's HSD.
|
Level
|
|
|
Mean
|
|
|
|
|
|
4
|
A
|
|
87.75
|
|
|
|
|
|
2
|
A
|
B
|
78.43
|
|
|
|
|
|
1
|
A
|
B
|
75.67
|
|
|
|
|
|
3
|
|
B
|
70.83
|
|
|
|
|
Levels not connected by same letter are significantly different.
** An experiment was conducted to see if different treatments of burning vegetation and soil disturbance could affect the density of plants that grew back on the study plots. Each of the treatments had an equal number of plots (balanced) that received that treatment, in a completely randomized design. The ANOVA table of the plant density that resulted is shown below. Some of the table is missing. Fill it in and interpret the results.
57. Between Group df=
58. Total df=
59. Within Group MS=
60. How many treatment groups were there?
61. How many plots were in each group?
** Briefly define - a line or two, with a sketch if you choose, is enough.
62. random sampling
63. z distribution
64. standardized values
65. standard deviation
66. nominal data
67. ordinal data
68. interval data
69. ratio data
70. precision
71. accuracy
72. F test
73. ANOVA
74. regression analysis
75. In the GEOG2700 forum, students postednews items regarding data analysis. Name one item or story that you found interesting (it could be yours or someone else's, in the Forum or just something you saw in the news). Describe it in a few lines.
Attachment:- Geographical Data and Analysis.rar