Reference no: EM131404623
Refer to the scatterplot for given Exercise showing the relationship between the average math SAT score and the percentage of high school graduates taking the test for the 50 states and District of Columbia. (The data are from the sats98 dataset on the companion website.) The regression line for these data is
Average math = 575 - 1.11 (percent took)
a. The slope of the equation is 21.11. Interpret this value in the context of how average math SAT changes when the percent of graduates taking the test changes.
b. In Missouri, only 8% of graduates took the SAT test. What is the predicted average math SAT score for Missouri?
c. In 1998, the average math SAT score for Missouri was 573. What is the residual (prediction error) for Missouri?
Exercise
The figure for this exercise is a scatterplot of y = average math SAT score in 1998 versus x = percent of graduating seniors who took the test that year for the 50 states and the District of Columbia. The data are from the sats98 dataset on the companion website.
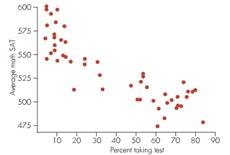
a. Does the plot show a positive association, a negative association, or no association between the two variables? Explain.
b. Explain whether you think the pattern of the plot is linear or curvilinear.
c. About what was the highest average math SAT for the 50 states and District of Columbia? Approximately, what percent of graduates took the test in that state?
d. About what was the lowest average math SAT for the 50 states and District of Columbia? Approximately what percent of graduates took the test in that state?
|
Explain the meaning of the slope of in given situation
: Is the relationship between x and y a deterministic relationship or a statistical relationship? Explain.- Explain what it would mean if x = 8.
|
|
How does law influence health and health behavior
: There is evidence that vaccinating school-aged children against influenza assists in limiting community-level transmission. Historically, the U.S. has had a long-standing, government-led strategy of recommending that vaccine distribution should be..
|
|
What are the first-order conditions for investment
: 5120 Economics Spring Assignment. Consider the firm investment model (from Section 9.2 and lecture) but without adjustment costs (so C(I) = 0 always). What are the first-order conditions for investment and the capital stock under this model? (use th..
|
|
Compile a stem and leaf display of these data
: The clubs whose fees appear in bold do not have a swimming pool. Highlight them in your display.
|
|
Does plot show positive association or negative association
: Does the plot show a positive association, a negative association, or no association between the two variables? Explain.
|
|
Describe statistics about health issue and the population
: Identify at least two different public health issues in your community or state (Georgia). Describe each issue to include identification of the target population, impact to the population and community, relevant statistics, current interventions, ..
|
|
Find the cumulative relative frequency for each class
: One branch of a bank has 849 customers who have credit balances in a certain type of current account. The sizes of the balances in these accounts, to the nearest £, have been arranged in the following grouped frequency distribution
|
|
Explain the specific risks benefits and internal controls
: Describe the different kinds of fraud andthe Fraud Triangle, an auditor's responsibility to identify and assess fraud. Describe the specific risks, benefits, and internal controls associated with IT functions.
|
|
Calculate the cumulative frequency for each class
: Draw a histogram to portray this distribution and comment on the shape of the distribution.
|