Reference no: EM131404894
For a statistics class project at a large northeastern university, a student examined the relationship between the following two variables:
x = body weight (in pounds)
y = time to chug a 12- ounce beverage (in seconds)
We'll leave it to you to imagine the beverage. The student collected data from 13 individuals, and those data are in the following table. (This dataset is named chugtime on the website for this book.)
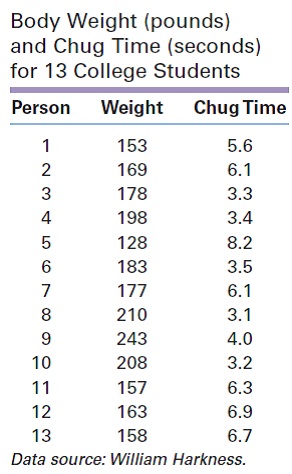
a. Draw a scatterplot of the measurements. Characterize the relationship between chug time and body weight.
b. The heaviest person appears to be an outlier. Do you think that observation is a legitimate observation, or do you think an error was made in recording or entering the data?
c. Outliers should not be thrown out unless there's a good reason, but there are several reasons why it may be legitimate to conduct an analysis without them (for instance, see part (e)). Delete the data point for the heaviest person, and determine a regression line for the remainder of the data.
d. Use the regression line from part (c) to estimate the chug time for an individual who weighs 250 pounds. Do you think this time could be achieved by anybody?
e. Sometimes the relationship between two variables is linear for a limited range of x values and then changes to a different line or curve. Using this idea, draw a sketch that illustrates what you think the actual relationship between weight and chug time might be for the range of weights from 100 to 300 pounds.
f. Discuss plausible reasons why the heaviest person appears to be an outlier with regard to his combination of weight and chug-time measurements.
|
Play inside disaster as all three of the different character
: COMM 200:Play Inside Disaster as all three of the different characters. What challenges did each character face? How did you feel while playing the game as each character? Take notes on the communication, goals, and interactions you see while playin..
|
|
Describe the relationship between given two variables
: Make a scatterplot showing the connection between average verbal SAT (y) and the percent of graduates who took the SAT in a state (x). Describe the relationship between these two variables.
|
|
What have been long-term consequences of mattels actions
: What have been the long-term consequences of Mattel's actions, and how did the company's implosion change our view of what it means for a company to be "socially responsible"?
|
|
Find helen’s home directory on the hard drive
: Research the solution for setting up Helen with a correctly named account.
|
|
Do you think an error was made in recording or entering data
: The heaviest person appears to be an outlier. Do you think that observation is a legitimate observation, or do you think an error was made in recording or entering the data?
|
|
How you will ensure the security of your valuable data
: This laptop is always with you at home, at school, and at work. Describe how you will ensure the security of your valuable data.
|
|
Speculate on relation between the religious economy approach
: According to the textbook, sociologists use the religious economy approach or a business perspective to describe religions as organizations competing with each other for followers. Speculate on the relation between the religious economy approach a..
|
|
Could a monarchy be pluralistic
: Explain why this system of government, under the rule of King George III of England, was so unacceptable to those living in the American colonies.What makes democracy, the system of government the Founding Fathers instituted in the United States,..
|
|
Do you already have access to high-speed internet
: Identify three additional tools that could be added to dorm life that would be popular and useful for you or your fellow students.
|