Display the data with a histogram

Assignment Help Basic Statistics
Reference no: EM131816512

Here are data for per capita beer consumption (in liters per person per year) in 18 countries during 2002.18

1604_data for per capita beer consumption.png

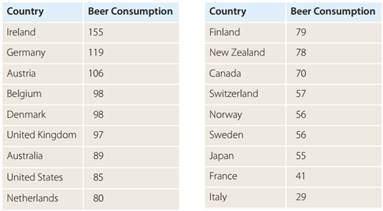
a. Display the data with a histogram, using rectangles with intervals of width 20 liters.

b. Explain why the sh

ape of the data suggests that the 68-95-99.7 Rule should work reasonably well.

c. The mean per capita consumption is approximately 80, and the standard deviation is approximately 30. What are the endpoints of the interval that extends within 1 standard deviation of the mean?

d. The 68-95-99.7 Rule estimates about 68% of values should fall in the interval you reported in part (c); what percentage of those 18 values actually fall within the interval?

e. What are the endpoints of the interval that extends within 2 standard deviations of the mean?

f. What percentage of those 18 values actually fall within the interval you reported in part (e)?

g. What are the endpoints of the interval that extends within 3 standard deviations of the mean?

h. What percentage of those 18 values actually fall within the interval you reported in part (g)?

i. Find the z-score for Ireland and report how many standard deviations below or above the mean its value is.

j. Which country has a z-score of 0.3?

k. Countries with consumption values even less than Italy's were not included. Would their z-scores be positive or negative?

Reference no: EM131816512

Questions Cloud

What would operating income have been with the order : The company typically uses a so-called cost-plus pricing system. Direct-material and direct-labor costs are computed, overhead is added at a rate of 115%.
How did the company handle the sales process : How did the company handle the sales process under its old system? How does CRM integrate with ERP
Stemplot for ages at death : The mean age at death is 15 years and the standard deviation is 7 years. What percentage of the dinosaurs' ages were within 1 standard deviation of the mean?
Prepare a tabulation of the performance for the full year : Prepare a tabulation of the performance for the full year including the final course. Assume that the costs of the final course for the 30 enrollees'.
Display the data with a histogram : Here are data for per capita beer consumption (in liters per person per year) in 18 countries during 2002.18
Calculate each of the four cost category groupings : calculating the sum for each separate cost category shown, and be aware it's likely that more than one expense item will apply in each calculation
How cost of producing and promoting movie affect decision : DVD Sales and Rental Markets Is it more profitable to sell your product for $45 or $12? This is a difficult question for many movie studio executives.
Calculate golden gate construction weighted-average cost : The cost of Golden Gate's equity capital is 15 percent. Calculate Golden Gate Construction Associates' weighted-average cost of capital
Clear majority in the sample : Your answer to part (b) indicates that a clear majority in the sample were able to match correctly for the purebred dogs.

Reviews

Write a Review

Basic Statistics Questions & Answers

  A sample of 150 values is randomly selected from a

a sample of 150 values is randomly selected from a population with mean ? equal to 43 and standard deviation ? equal to

  Question regarding the binomial distribution

It is given that 60% of the employees at a large company are women. A simple random sample of 15 employees is selected from this company.

  Should you use the binomial distribution

A manufacturer of running shoes picks a random sample of the production of shoes each day for a detailed inspection. Today's sample of 20 pairs of shoes includes 1 pair with a defect.

  Calculate the overall cpi for the retired person and for the

Calculate the overall CPI for the retired person and for the college student by multiplying the CPI for each of the categories by the relative importance of that category to the individual and then summing each of the categories. How do your calculat..

  Calculate spread of the comparison distribution

If you are performing a hypothesis test using a z statistic in which you sampled 50 people and found an average SAT verbal score of 542.

  Description of goodness of fit test

Based upon all of this information, do a "goodness-of-fit" test to see if the distributions are the same as they were two years ago. Use a level of confidence of .01. Should we accept Ho or reject Ho?

  What is the probability that the freshman class is a female

COLLEGE MAJORS The Office of Admissions and Records of a large western university released the accompanying information concerning the contemplated majors.

  Computing the conditional probability

3 cards are randomly selected without replacement from an ordinary deck of 52 playing cards. Compute the conditional probability that the first card selected is a spade, given that the second and third cards are spades.

  Find the pairs of variables as independent

Use your general knowledge to label the following pairs of variables as independent or associated. Explain.

  Difference between a null and an alternative hypothesis

What is the difference between a null hypothesis and an alternative hypothesis? Is the null hypothesis always the same as the verbal claim or assertion that led to the test? Why or why not?

  Describe three instances of variability

Getting ready Look out your window again. Describe three instances of variability in what you see. Does the variability strike you as good or not so good? What seems to be the cause (or causes) of the variability?

  A population proportion is to be estimated estimate the

a population proportion is to be estimated. estimate the minimum sample size needed to achieve the specified margin of

Free Assignment Quote

Assured A++ Grade

Get guaranteed satisfaction & time on delivery in every assignment order you paid with us! We ensure premium quality solution document along with free turntin report!

All rights reserved! Copyrights ©2019-2020 ExpertsMind IT Educational Pvt Ltd