Discuss the free flight behaviour of the truck

Assignment Help Mechanical Engineering
Reference no: EM132087745

Project: Dynamic modelling and Analysis

Project Details

Your project is to analyse the performance of a quad bike similar to the one shown in Figure 1. You are to analyse the quad bike as a mechanical system using mathematical modelling and vibration analysis. You will also have to consider riders of different masses and different payloads weights that the bike may be used to carry. You will be asked to analyse this same system in Project 2 with increased degrees of freedom and application of control.

Table 1 shows the basic specifications to be used. Any assumptions or additional information you use should be clearly stated and justified. It is recognised you may not have all the information you require but any values you assume should be within believable levels.

Your report will include:
- Specifications of suitable suspension parameters: stiffness and damping. Based on initial research and speculations of quad bike use. The design should also be informed by an iterative process and based on your analysis
- An evaluation of the quad bike's suspension performance, vibrations and transients.
- Addressing of all the Reflection and Discussion points
- Also see the assessment criteria at the end of this document to check you have included everything you need in the report

Table 1: Quad Bike Specifications (Yamaha Australia 2018)

Engine:

708cc, DOHC, four-stroke, single cylinder,

liquid-cooled

Transmission:

Ultramatic V-belt

Chassis- Dimensions:


Overall Length:

2070mm

Overall Width:

1230mm

Overall Height:

1253mm

Tires/Front:

AT 26 x 8-12

Tires/Rear:

AT 26 x 10-12

Suspension Front:

Independent double wishbone, 193mm travel

Suspension Rear:

Independent double wishbone, 232mm travel

Seat Height:

918mm

Wheelbase:

1250mm

Ground Clearance:

288mm

Fuel Capacity:

18 litre

Wet Weight:

314kg

PART A: Problem Scope, Assumptions and Limitations

State and justify the assumptions you make of the Quad bike expected use, payload details and variations (i.e. rider mass, payload mass, location, mass variations, and road variations). Use these variations in each of the following analysis where appropriate.

State any analysis your report does not cover but could have been done if a larger analysis was required and more time and information was available.

Make an estimate of the tyre properties, do not spend a lot of time getting ‘good numbers' it is your analysis that is important. State clearly how you obtain this, you may use experimentation, measurement of existing tyre deflection on vehicle of known mass. Accuracy is less important than your approach, however, ensure your estimates are within a sensible range. You may wish to consider a range of tyre properties based on varying tyre pressures that are used for the quad bike tyres specified in Table 1.

PART B: Single Degree of Freedom

For this part your analysis is to be limited to treating the quad bike as dynamic system with a single degree of freedom. This will help with the aim to determine suitable suspension stiffness and damping, vary these through the analysis to see the effect and to determine the best combination.

Your analysis will include the points below (include and compare different types of analysis using vibration equations, Matlab and Simulink where appropriate). Explain your working and models so an engineer could understand your process, results and findings of each point. Use each analysis point to help in the main aim described in Section 2.0.

Draw a mathematical model schematic of the quad bike.

Simplify the system to a single degree of freedom system (vertical motion only -Assume there is no roll or pitch.).
Draw the 1 DOF free body diagram and write the modelling equation.
Analyse the free vibration response for the expected variations in Part A.
Analyse forced vibration. Assume a small imbalance occurs in the engine.
Analyse surface induced vibration analysis. Assume road speeds from 0kph to 50kph. Assume a simplified corrugation shape (e.g. a sine wave) and a set of realistic road corrugation depths and wavelengths.
Determine under what conditions resonance may occur and the magnitude effect on the bike.
Produce suitable plots of magnification factor and transmissibility factor to help with the analysis points above.
Determine suitable Laplace transforms of the modelling equation. From this equation develop a transfer function describing the system. Also examine Stability criteria and produce a Bode plot for the system. Compare with your Bode diagrams with plots of magnification factor and transmissibility factor.
Model the system in Simulink and repeat the analysis points (B.4 to B.9). Compare the Simulink results with the theoretical calculations and explain any differences (also use this to check your results, and to show if you need to correct either your analysis or your models)
Add non-linearities to the spring mass model in Simulink to make it more reflective of the real situation [Keep the model as a single DOF]. Demonstrate the non-linearities behave as expected. Repeat the analysis points above where suitable and compare with your previous results. Draw some conclusions from your comparison.
In a conclusion to Part B, state the best suspension stiffness and damping found and summarise your key findings and observations. The findings in this part will be a good starting point for the next parts.

Part C: Two Degree of Freedom - Vertical Two Mass

Part C is to improve the model you developed in Part B and again analyse the dynamic performance with the aim to determine more suitable suspension stiffness and damping values.

The first improvement in the model to be evaluated will be inclusion of the unsprung mass of the wheels, axles and the stiffness of the tyres.

As before your analysis will include the points below (include and compare different types of analysis using vibration equations, Matlab and Simulink where appropriate). Explain your working and models so an engineer could understand your process, results and findings of each point. Use each analysis point to help in the main aim presented in Section 2.

Simplify the quad bike system to a two degree of freedom system (two masses, vertical motion only-Assume there is no roll or pitch).
Draw the simplified model schematic and the 2DOF FBD and write the modelling equations.
From these equations using calculations or Matlab determine the free undamped resonance frequencies and mode shapes. Discuss the meaning of the results with respect to your aim to analysis of the quad bike.
Create a suitable 2DOF Simulink Model to also confirm the results above.

Using the 2DOF Simulink model, analyse road surface induced vibration. Assume road speeds from 0kph to 50 kph. Assume a simplified corrugation shape and a set of realistic road corrugation depths and wavelengths.
Create suitable damped transfer functions and use Matlab scripts to create bode plots for the damped system undergoing road surface induced vibration.
Add non-linearities to the spring mass model in Simulink to make it more reflective of the real situation [Keep the model as a two DOF system]. Demonstrate the non-linearities behave as expected. Repeat the previous road surface analysis and compare with your previous results. Draw some conclusions from your comparison.
In a conclusion to Part C, state the best suspension stiffness and damping found and summarise your key findings and observations.

Part D: Two Degree of Freedom - Vertical and Pitch
Part D is to improve the model you developed in Part B and again analyse the dynamic performance with the aim to determine more suitable suspension stiffness and damping values.
The first improvement in the model to be evaluated will be inclusion of the unsprung mass of the wheels, axles and the stiffness of the tyres.
As before your analysis will include the points below (include and compare different types of analysis using vibration equations, Matlab and Simulink where appropriate). Explain your working and models so an engineer could understand your process, results and findings of each point. Use each analysis point to help in the main aim presented in Section 2.

Simplify the quad bike system to a two degree of freedom system (one mass, vertical motion and pitch motion).
In addition to the information you have from earlier problems you will need to estimate moments of inertia as best you can from the diagram and mass data. Check the moment of inertia value is a realistic value, as it will greatly affect your following analysis.
Draw the simplified model schematic and the 2DOF FBD and write the modelling equations.
From these equations using calculations or Matlab determine the free undamped resonance frequencies and mode shapes. Discuss the meaning of the results with respect to your aim to analysis of the quad bike.
Create a suitable 2DOF Simulink Model to also confirm the results above.
Using the 2DOF Simulink model, analyse road surface induced vibration. Assume road speeds from 0kph to 50 kph. Assume a simplified corrugation shape and a set of realistic road corrugation depths and wavelengths.
Create suitable damped transfer functions and use Matlab scripts to create bode plots for the damped system undergoing road surface induced vibration.
Add non-linearities to the spring mass model in Simulink to make it more reflective of the real situation [Keep the model as a two DOF system]. Demonstrate the non-linearities behave as expected. Repeat the previous road surface analysis and compare with your previous results. Draw some conclusions from your comparison.
In a conclusion to Part D, state the best suspension stiffness and damping found and summarise your key findings and observations.

Part E: Modelling of Ramp
The last part of your analysis will be to examine performance over a jump ramp as shown in Figure 2 using each of your Simulink models from Part B, C and D. It is suggested to start with the Part B model (1 DOF).

1662_Ramp Dimensions.jpg

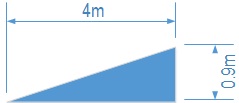
Figure 2: Ramp Dimensions

Determine and use the best suspension stiffness and damping determined from your analysis in the previous Parts.

Use each Simulink model in Parts B, C and D to get an indication of the quad bike's performance over the ramp. You may need to correct/modify the non-linear characteristics. Think of what would be important in the design if the bike was required to perform the stunt and use each of the Simulink models to help improve the suspension parameters and mass distribution. Each Simulink model will help in different ways.

Discuss the free flight behaviour of the truck over the jump and the simulation of ground contact forces.
Draw conclusions if you were to increase the number of DOF's of how accuracy will be improved.

Part F: Discussion and Conclusion
Reflect and discuss the following points in regards to the quad bike analysis:

Compare the results of the different analysis of the quad bike done in Parts B, C and D. In which cases was the simple model (Part B) suitable, and in which cases was higher order models required (Part C and D).

Discus the usefulness of the different analysis performed in determining the suspension stiffness and damping values of the quad bike.
Discuss the differences between your linear and non-linear models of the quad bike.

Based on the quad bike analysis, reflect on the: differences, advantages and disadvantages of frequency domain analysis (Laplace, frequency response etc.) verses time domain (simulation, time series outputetc.).

Reflect on your final suspension design for the quad bike. i.e. Do you think the spring - damper combination selected is suitable? How could it be improved? What method/steps would you do to improve it? Would you have done anything different if you were to redo the design/analysis?

Write a final conclusion to the whole project report, stating the best suspension stiffness and damping you have found from all your analysis. Summarise your key findings and observations.

Attachment:- Project.rar

Reference no: EM132087745

Questions Cloud

Impact of cash flow forecasting in hospitals : What are the impact of cash flow forecasting in hospitals based on utilization, physician competition, technology, cost of providing care, and hospital
Briefly describe the traffic-services and hardware trends : Briefly describe the traffic, services, and hardware trends in business networks.
The new england journal of medicine : Write a research paper about the Type 2 Diabetes and discuss about The New England Journal of Medicine.
Review problem regarding cost functions : Do you think that employees should be involved with setting up cost functions or is this just a management thing?
Discuss the free flight behaviour of the truck : ENEM20001 - Discuss the free flight behaviour of the truck over the jump and the simulation of ground contact forces - Discus the usefulness of the analysis
Develop sophisticated cost functions : A company invests considerable time and money to develop sophisticated cost functions that rate high on all evaluative criteria.
Analyze the effectiveness of the naacp : From the e-Activity and this week's readings, analyze the effectiveness of the NAACP and the club movement in furthering the goal of equality.
Give a brief history of the pentecostal-charismatic movement : Give a brief history of the Pentecostal-Charismatic movement beginning with Charles Parham and Joseph Seymour.
Implications of lean npi for different types of innovation : Discuss the relevance and practical implications of Lean NPI for different types of innovation.

Reviews

len2087745

8/16/2018 10:17:59 PM

F.4 Based on the quad bike analysis, reflect on the: differences, advantages and disadvantages of frequency domain analysis (Laplace, frequency response etc.) verses time domain (simulation, time series output etc.). 1 F.5 Reflect on your final suspension design for the quad bike. i.e. Do you think the spring - damper combination selected is suitable? How could it be improved? What method/steps would you do to improve it? Would you have done anything different if you were to redo the design/analysis? 2 F.6 Write a final conclusion to the whole project report, stating the best suspension stiffness and damping you have found from all your analysis. Summarise your key findings and observations. 1 Report Structure/Presentation and Language

len2087745

8/16/2018 10:17:48 PM

PART F: Discussion and Conclusion (10 Marks) F.1 Compare the results of the different analysis of the quad bike done in Parts B, C and D. In which cases was the simple model (Part B) suitable, and in which cases was higher order models required (Part C and D). 3 F.2 Discus the usefulness of the different analysis performed in determining the suspension stiffness and damping values of the quad bike. 2 F.3 Discuss the differences between your linear and non-linear models of the quad bike. 1

len2087745

8/16/2018 10:17:29 PM

D.6 Using the 2DOF Simulink model, analyse road surface induced vibration. Assume road speeds from 0kph to 50 kph. Assume a simplified corrugation shape and a set of realistic road corrugation depths and wavelengths. 4 D.7 Create suitable damped transfer functions and use Matlab scripts to create bode plots for the damped system undergoing road surface induced vibration. 2 D.8 Add non-linearities to the spring mass model in Simulink to make it more reflective of the real situation [Keep the model as a two DOF system]. Demonstrate the non-linearities behave as expected. Repeat the previous road surface analysis and compare with your previous results. Draw some conclusions from your comparison. 2 D.9 In a conclusion to Part D, state the best suspension stiffness and damping found and summarise your key findings and observations. 1

len2087745

8/16/2018 10:17:11 PM

PART D: Two Degree of Freedom – Vertical and Pitch (20 Marks) D.1 Simplify the quad bike system to a two degree of freedom system (one mass, vertical motion and pitch motion). D.2 In addition to the information you have from earlier problems you will need to estimate moments of inertia as best you can from the diagram and mass data. Check the moment of inertia value is a realistic value, as it will greatly affect your following analysis. 2 D.3 Draw the simplified model schematic and the 2DOF FBD and write the modelling equations. D.4 From these equations using calculations or Matlab determine the free undamped resonance frequencies and mode shapes. Discuss the meaning of the results with respect to your aim to analysis of the quad bike. 3 D.5 Create a suitable 2DOF Simulink Model to also confirm the results above. 6

len2087745

8/16/2018 10:16:56 PM

C.5 Using the 2DOF Simulink model, analyse road surface induced vibration. Assume road speeds from 0kph to 50 kph. Assume a simplified corrugation shape and a set of realistic road corrugation depths and wavelengths. 4 C.6 Create suitable damped transfer functions and use Matlab scripts to create bode plots for the damped system undergoing road surface induced vibration. 2 C.7 Add non-linearities to the spring mass model in Simulink to make it more reflective of the real situation [Keep the model as a two DOF system]. Demonstrate the non-linearities behave as expected. Repeat the previous road surface analysis and compare with your previous results. Draw some conclusions from your comparison. 2 C.8 In a conclusion to Part C, state the best suspension stiffness and damping found and summarise your key findings and observations. 1

len2087745

8/16/2018 10:16:47 PM

PART C: Two Degree of Freedom – Vertical Two Mass (20 Marks) C.1 Simplify the quad bike system to a two degree of freedom system (two masses, vertical motion only—Assume there is no roll or pitch). 2 C.2 Draw the simplified model schematic and the 2DOF FBD and write the modelling equations. C.3 From these equations using calculations or Matlab determine the free undamped resonance frequencies and mode shapes. Discuss the meaning of the results with respect to your aim to analysis of the quad bike. 3 C.4 Create a suitable 2DOF Simulink Model to also confirm the results above. 6

len2087745

8/16/2018 10:16:21 PM

B.10 Model the system in Simulink and repeat the analysis points (B4 to B9). Compare the Simulink results with the theoretical calculations and explain any differences (also use this to check your results, and to show if you need to correct either your analysis or your models) 7 B.11 Add non-linearities to the spring mass model in Simulink to make it more reflective of the real situation [Keep the model as a single DOF]. Demonstrate the non-linearities behave as expected. Repeat the analysis points above where suitable and compare with your previous results. Draw some conclusions from your comparison. 2 B.12 In a conclusion to Part B, state the best suspension stiffness and damping found and summarise your key findings and observations. The findings in this part will be a good starting point for the next parts. 1

len2087745

8/16/2018 10:16:11 PM

PART B: Single Degree of Freedom (20 Marks) B.1 Draw a mathematical model schematic of the quad bike. B.2 Simplify the system to a single degree of freedom system (vertical motion only –Assume there is no roll or pitch.). 2 B.3 Draw the 1 DOF free body diagram and write the modelling equation. B.4 Analyse the free vibration response for the expected variations in Part A. B.5 Analyse forced vibration. Assume a small imbalance occurs in the engine. B.6 Analyse surface induced vibration analysis. Assume road speeds from 0kph to 50kph. Assume a simplified corrugation shape (e.g. a sine wave) and a set of realistic road corrugation depths and wavelengths. B.7 Determine under what conditions resonance may occur and the magnitude. 8 B.8 Produce suitable plots of magnification factor and transmissibility factor to help with the analysis points above. B.9 Determine suitable Laplace transforms of the modelling equation. From this equation develop a transfer function describing the system. Also examine Stability criteria and produce a Bode plot for the system. Compare with your Bode diagrams with plots of magnification factor and transmissibility factor.

len2087745

8/16/2018 10:15:59 PM

Table 2: Detailed Assessment Criteria Criteria Max Grade Grade PART A: Problem Scope, Assumptions and Limitations (10 Marks) A.1 State and justify the assumptions you make of the Quad bike expected use, payload details and variations (i.e. rider mass, payload mass, location, mass variations, road variations) 5 A.2 State any analysis your report does not cover but could have been done if a larger analysis was required and more time and information was available. 2 A.3 Make an estimate of the tyre properties. 3

len2087745

8/16/2018 10:14:54 PM

While this is a team report, each member of the team may receive varying grades, see coversheet (next page). The team report will be graded on the main elements of modelling through to analysis, discussion and conclusions. The report should also be professionally presented, clearly show and explain the development of modelling equations, models including any assumptions or limitations of the analysis. A detailed marking criteria specific to the project elements is included at the end of this document. To maximise time spent on the unit's core aim it is recommended that diagrams are hand-drawn and any mathematical equations or working be handwritten and scanned into the document. The report should be written and contain enough detail such that an engineer could understand, check and if necessary repeat the work described.

Write a Review

Mechanical Engineering Questions & Answers

  Then calculate the annual cost to operate a 60-w 75-w and

light bulbs are rated by their power consumption in watts w. electricity is sold in units of energy which is power

  Determine the image curve in the w plane

determine the image curve in the w plane

  Specify proper fail-safe action for valves in natural gas

Specify the proper fail-safe action for the valves in the following services. Please explain your reasons. A valve manipulates the flow of natural gas (combustible) to a furnace. Another valve manipulates the flow of combustion air to the same fur..

  Find the horsepower to circulate the flow

Consider a recalculating flow in the power cycle shown in the figure. The fluid flowing in 100 ft of smooth pipe have an average specific weight of 50 lbf/ft3 and average dynamic viscosity of 5×10⁻⁴ lbf.s/ft2. Head loss in the nuclear reactor is 75 f..

  Assume the pressure in the air above the water was 40 kpa

during a certain movie on cavitation dr. kavi tae shun held in his hand a closed cylinder filled with water and air. he

  After the block is released from rest it travels upward and

a block of mass 0.256 kg is placed on top of a light vertical spring of force constant 4 925 nm and pushed downward so

  What is the mass flow rate of the coolant water

Saturated steam flowing at 3.5 kg/s and 200 kPa is condensed into saturated liquid at the same pressure in a counter-flow heat exchanger. The coolant is water with an inlet temperature of 18 degrees Celsius and an outlet temperature of 35 degrees Cel..

  Heater is used to raise the temperature of a thermodynamics

A heater is used to raise the temperature of a Thermodynamics classroom by 5.0 o C. Express this temperature rise in units of Kelvin? A heater is used to raise the temperature of a Thermodynamics classroom by 5.0 oC. Express this temperature rise in ..

  During the process there is heat transfer to the steam with

5 kg of steam contained within a piston-cylinder assembly undergoes an expansion from state 1 where the specific

  If the exit pressure is 200 kpa and the inlet volumetric

an air compressor is powered by a 2hp motor assume this is all input to the compressor. the inlet pressure and

  Oxygen-rich and virtually carbon-free environment

An iron-carbon alloy initially containing 0.55 wt% C is exposed to an oxygen-rich and virtually carbon-free environment at 1325 K. Under these conditions, the carbon diffuses from the alloy and reacts with oxygen at the surface.

  Hexagonal close-packed crystal structure

Consider a hypothetical metal that has a hexagonal close-packed crystal structure and an atomic weight of 70.28 g/mol. If the atomic radius is 0.1473 nm and the c/a ratio is 1.723, then calculate (a) the unit cell volume, and (b) the density of the m..

Free Assignment Quote

Assured A++ Grade

Get guaranteed satisfaction & time on delivery in every assignment order you paid with us! We ensure premium quality solution document along with free turntin report!

All rights reserved! Copyrights ©2019-2020 ExpertsMind IT Educational Pvt Ltd