Reference no: EM132411811
Assignment - Answer All Questions.
Question 1 - Consider the predictive regression framework given by:
yt+1 = α + βxt + εt+1
xt+1 = γ + δxt + μt+1
If an econometrician estimates β, discuss some of the problems that may arise. In particular, discuss the importance of the error term structure, serial dependence in the regressor, and the nature of the sampling.
Question 2 - Y follows an AR(1) process given by:
Yt = α + βYt-1 + εt
where ε ∼ iid N(0, σ2). Write down the infinite order MA representation and show that if |β| < 1 then the mean of the process is a α/(1-β).
Question 3 - You want to test whether activist investors limit executive compensation. You have balanced panel data for 100 firms over 10 years. For each firm-year observation you have data on CEO salary and detailed data on who owns every share of stock. You have three firm-year characteristics of your choice as control variables. Finally, you have an instrument for activist ownership. The instrumental variable can be anything you want, whether or not it is even observable - but you have to come up with it. Design a regression framework to test the causal hypothesis that activists limit CEO pay. Describe your instrumental variable and control variables in detail. Be specific about the parameters, identification, and estimation of the stand rd errors.
Question 4 - You have panel data (100 firms over 20 years) where the independent variables (X) have strong time series persistence, though they may be of different form. For example, maybe X1 follows an AR(1) and X2 follows an AR(5), etc. You don't have any information on the time series properties of the dependant Y variable. For each cross-section you have a clean test in the sense that E[X'ε] = 0. In a panel regression setting, how should you estimate your standard errors?
Question 5 - A fuzzy RDD is really just instrumental variables. Discuss.
Question 6 - House prices in Dallas and Houston are cointegrated. Consider a simple "error correction" specification as in:
ΔDallast = β0 + β1ΔHoustont + γ1(Dallast-1 - Houstont-1) + εt
Using annual house price indicies we estimate the parameters using OLS and get:
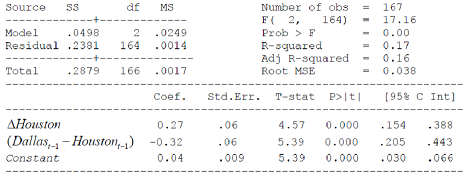
Do house prices in Houston error-correct to house prices in Dallas, or is it the other way around? What can be learned from this regression alone? Be specific about each parameter and how you interpret it. Do the signs of the estimated coefficients match what you would expect?
Question 7 - You have a time series of eggs, Et, and a time series of chickens, Ct. Describe all the steps you would take to test empirically whether chickens and eggs are cointegrated. Also, describe how you would test which comes first, the chick or the egg.
Question 8 - You are at a cocktail reception at a finance conference. John Cochrane claims that there is strong predictability in returns using valuation ratios like the dividend yield. No Welch is there and he argues that no, there is no predictability at all out-of-sample. The argument gets heated and it looks like there may be a fight. You step in between them and say "Hey guys - don't fight - you're both right!" What's your argument?
Question 9 - Causal inference is the objective of all applied econometrics. It is the only way we really know anything. Famous statistician Paul Holland (1986) cautions that there can be "no causation without manipulation." His maxim that would seem to rule out causal inference from non-experimental data. Discuss.
Question 10 - What's the relationship between propensity score matching and a regression discontinuity design?
Question 11 - We saw from Mitchell Peterson's paper about clustering standard errors that two-way clustering across both the firm and time dimension often dominates fixed-effects specifications and/or Fama-Macbeth specifications. Why?
Question 12 - You probably have not read a paper by Biddle and Hamermesh (1990), Sleep and the Allocation of Time, Journal of Political Economy 98, 922-943. They study whether there is a trade-off between hours slept per week and time spent in paid work. In their model sleep is minutes spent sleeping during the week and work-time is minutes spent working. With about 800 observations and an R-squared of about 10%, they estimate:
(Sleep)^ = 3600 - 0.160 worktime
What does the intercept mean?
If someone works 10 more hours a week, how much less sleep do they get on average per night?
How "clean" is the result on the substitution between sleep and work? Could work simply be instrumenting for something else?
Question 13 - In empirical asset pricing tests, we often look at the returns of portfolios in the top decile of some risk dimension, like beta, and compare returns to the bottom decile. We seem to do this for each factor loading independently. Why do sorts of this kind? Why not just run a regression?
Question 14 - Consider an augmented model that includes other factors such as years of education and age. Same sample, this model has an R-squared of about 12%.

Standard errors are reported below the coefficient estimates in brackets.
Do the signs on education and age have the right signs?
If I go to college and graduate, will I sleep less?
Discuss the economic and statistical significance of education and age on sleep.
How would you test the joint significance of sleep and age?
Question 15 - What is bid-ask bounce? Show that the existence of a wedge between bid and offer prices drive a bas into estimates of return variance and serial correlation in prices. How should one correct for these biases?