Reference no: EM131019250
Your group will develop four different population scenarios for a town. As a group, you will decide on the name of the town and the initial population. You will graph the function for each population scenario and use your model to make some decisions about the population.
1) Decide on a name of a rural town. Name of town: Milford, Pennsylvania
2) Decide on an initial population, P0, of the town in the year 2010. Choose an initial population between 1000-5000. Use this value of P0 for each of the scenarios. P0 = _1,292
3) You will investigate four different scenarios of population growth or decline in this town.
- Linear growth
- Growth modeled by a quadratic equation
- Growth modeled by a radical equation
- Population decline modeled by a rational equation
I. Linear Growth:
Suppose that the amount that your town's population grows each year is fixed (or constant).
Choose the amount of population growth each year = _100____
(Hint: Choose a whole number for your growth rate, rather than a percent.)
a) Fill in the following chart:
|
Year (t)
|
Population (P)
|
|
t = 0
(2010)
|
P0 =_1,292__
|
|
t = 1
(2011)
|
1,392
|
|
t = 2
(2012)
|
1,492
|
|
t = 3
(2013)
|
1,592
|
|
t = 6
(2016)
|
1,892
|
|
Click in this box and type the name(s) of the student(s) who uploaded this problem (I) and who checked it for accuracy.
Done by: Kurt Steinmuller
Checked by:
|
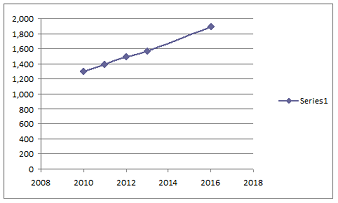
b) Find a linear equation in the form P = mt + b (y = mx + b), which gives the population, P, t years from 2010.
c) Use your equation in part b to approximate the population in the year 2025.
d) Use your equation in part b to approximate how many years it will take the population to reach 12,000.
e) Graph this function in MS Excel or another web-based graphing utility by plotting the points found in your chart in part a. Label your axes with time on the x-axis and population on the y-axis. Read the information in the assignments list to learn more about how to graph in MS Excel. Copy and paste your graph here:
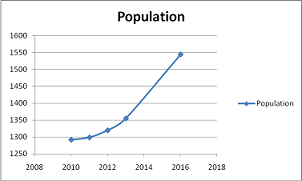
II. Quadratic Growth:
Suppose instead that the town experiences quadratic growth of the form
P = 7t2 + p0 where t is the time in years from 2010.
a) Insert the value of P0 that your group has decided upon into the equation. Use t2 to type t-squared.
b) Fill in the following chart.
|
Year (t)
|
Population (P)
|
|
t = 0
(2010)
|
P0 =___1292__
|
|
t = 1
(2011)
|
1299
|
|
t = 2
(2012)
|
1320
|
|
t = 3
(2013)
|
1355
|
|
t = 6
(2016)
|
1544
|
|
Click in this box and type the name(s) of the student(s) who uploaded this problem (I) and who checked it for accuracy.
Done by: Kurt Steinmuller
Checked by:
|
c) Use your equation from part a to approximate how many years it will take for the population to reach 12,000. Round to the nearest whole year when necessary.
d) Graph this function in MS Excel or another web-based graphing utility by plotting the points found in your chart in part a. Label your axes with time on the x-axis and population on the y-axis. Read the information in the assignments list to learn more about how to graph in MS Excel. Copy and paste your graph here:
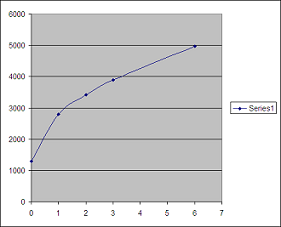
III. Growth Modeled by a Radical Equation:
Suppose instead that the town experiences growth that can be modeled by the following: P = 1500 √t + P0 where t is the number of years from 2010.
a) Insert the value of P0 that your group has decided upon into the equation above. Use the Equation Editor or type square root of t as √(t).
b) Fill in the following chart. Round to the nearest whole person when necessary.
|
Year (t)
|
Population (P)
|
|
t = 0
(2010)
|
P0 =___1292___
|
|
t = 1
(2011)
|
2792
|
|
t = 2
(2012)
|
3413
|
|
t = 3
(2013)
|
3890
|
|
t = 6
(2016)
|
4966
|
|
Click in this box and type the name(s) of the student(s) who uploaded this problem (I) and who checked it for accuracy.
Done by: Kurt Steinmuller
Checked by:
|
c) Use your equation from part a to approximate how many years it would take for the population to reach 12,000. Round to the nearest whole year when necessary.
d) Graph this function in MS Excel or another web-based graphing utility by plotting the points found in your chart in part a. Label your axes with time on the x-axis and population on the y-axis. Read the information in the assignments list to learn more about how to graph in MS Excel. Copy and paste your graph here:
IV. Population Decline Modeled by a Rational Equation:
Suppose instead that the town experiences population decline that can be modeled by the following: P = P0 / (t +1) where t is the number of years from 2010.
a) Insert the value of P0 that your group has agreed to use.
Type as (P0) / (t + 1) or use the Equation Editor.
b) Fill in the following chart. Round to the nearest whole person when necessary.
|
Year (t)
|
Population (P)
|
|
t = 0
(2010)
|
P0 =_1,292___
|
|
t = 1
(2011)
|
646
|
|
t = 2
(2012)
|
431
|
|
t = 3
(2013)
|
323
|
|
t = 6
(2016)
|
185
|
|
Click in this box and type the name(s) of the student(s) who uploaded this problem (I) and who checked it for accuracy.
Done by: Kurt Steinmuller
Checked by:
|
c) Use your equation from part a to approximate how many years it would take for the population to reach 400. Round to two decimal places if necessary.
Approximately it would take 2 years for the population to reach 400.
d) Graph this function in MS Excel or another web-based graphing utility by plotting the points found in your chart in part a. Label your axes with time on the x-axis and population on the y-axis. Read the information in the assignments list to learn more about how to graph in MS Excel. Copy and paste your graph here:
V. Suppose that the mayor of the town you have chosen has built a new factory in hopes of drawing as many new people to the town as possible. Which one of the four models would the mayor hope that the population would follow? Explain.