Develop a matlab program for encoding a data sequence

Assignment Help MATLAB Programming
Reference no: EM131651655

Mobile and Satellite Communication Systems

Description of Assessment Task:

In this assignment you will develop and test a Matlab program for encoding a data sequence using QPSK modulation. The result will be a graph of phase modulated carrier corresponding to the data steam.

The data sequence to encode is d = [0 1 1 0 0 0 1 1].

Follow the steps to complete the task and write a report.

Step 1: Describe your QPSK constellation diagram.
            Use the following QPSK constellation diagram:

957_figure.png

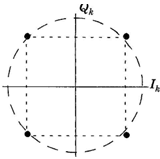
Calculate how many bits per each state (point) on the constellation diagram can you assign. Assign each state a bit group of your choice and show the bit groups on the diagram.

Step 2: Determine In-phase and Quadrature carrier wave components for each point on the constellation diagram.

For each point on the constellation diagram, determine amplitudes of In-phase and Quadrature components for carrier waves in sin or cos form.

Prepare a table showing how to add In-phase and Quadrature components for each state.

Step 3: Demonstrate In-phase and Quadrature components addition for each state.

In Matlab write a code to display 3 subplots: one showing In-phase carrier wave (sin), one for Quadrature wave (cos) and one subplot for resultant carrier wave representing one state on the constellation diagram, which was obtained by addition of In-phase and Quadrature components. Include titles for each subplot. Assume absolute amplitudes of input waves are equal to 1, choose frequency and time interval to fit a few periods of the sinusoid for clear visibility on the graph. Comment on the initial phase of the resultant wave after addition and its relation to the constellation diagram. (Alternatively create the plot by drawing or other method).

Repeat for all 4 states.

Write code and export each figure into a .jpg file. (Alternatively use save button in Matlab).

Step 4: Encode data.

Break up the data sequence into groups of correct number of bits, each representing a state from the constellation diagram.

Step 5: Plot modulated carrier wave corresponding to the given data sequence.

In Matlab write a code to display a plot of modulated carrier wave corresponding to the given data sequence by joining resultant waves constructed in step 3 in correct sequence. Use 5 carrier cycles per modulation state. (Alternatively create the plot by drawing or other method).

Export image into a .jpg file.

General guidelines

The Assignment 2 report format should include the title page with assignment title, your name and student number and sections entitled Introduction, Method, Results, and Discussion. Subsections may be included as required. References should be in IEEE format. Attach your Matlab code to your report as appendix.

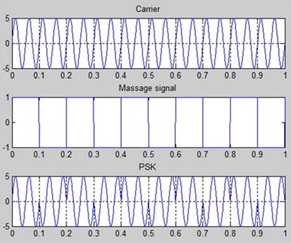
Sample modulated carrier for BPSK for reference:

2007_figure1.jpg

Verified Expert

The assignment discusses the QPSK digital modulation technique and its implementation in Matlab. The constellation diagram, symbols associated with QPSK and the actual modulation for a given digital sequence are simulated in MATLAB and the results are analyzed for better understanding.

Reference no: EM131651655

Questions Cloud

Short-run price of elasticity of supply : What is the short-run price of elasticity of supply rounded to 2 decimals.
Explain the budget cycle and process : You will describe what a financial reporting system is and explain how management of ICBI should use an activity based budget instead of an operating budget.
What organizations regulate the agency : Describe agency purpose, program(s) and services and resources provided to clients. What organizations regulate the agency? What other agencies regulate agency?
Quantity demanded and supplied should be : Can markets always reach equilibrium and determine what the price of a product and its quantity demanded and supplied should be?
Develop a matlab program for encoding a data sequence : Develop and test a Matlab program for encoding a data sequence using QPSK modulation. The result will be a graph of phase modulated carrier
Explain each part of the key components : Health Care Information Systems are important in dispensing of information throughout the organization. You will develop a research paper on a health care.
Can you explain how to calculate deadweight loss : Can you explain how to calculate deadweight loss? Also, what is price discrimination - first, second and third?
Adjustment process of pure competition : How do profits and losses drive the long-run adjustment process of pure competition?
What is the significance of opportunity cost : What is the significance of opportunity cost? Why are Pareto efficiency policies impractical? Explain the Potential Pareto efficiency criterion.

Reviews

inf1651655

12/23/2017 4:46:54 AM

Thank you for the very good service the expert very help me and work very hard for me. Thank you for the work. i am really satifised with the solution and the punctuality.

inf1651655

12/23/2017 4:46:31 AM

I have recommended this site to many of my friends so am I laible getting discount? and can I utilize the $50 discount of completing 1000 points as well? No I don't need 3600 words in report just 1200 words are okay excluding coding, we can cover 8 pages with snap shots of plots and other related photos.

len1651655

9/21/2017 2:16:13 AM

Explanation/ justification All elements are present and well integrated. Components present with good cohesion. Components present and mostly well integrated. Most components present. Lacks structure. Demonstration Logic is clear and easy to follow with strong arguments. Consistency logical and convincing. Mostly consistent logical and convincing. Adequate cohesion and conviction. Argument is confused and disjointed. Reference style Clear styles with excellent source of references. Clear referencing/ style. Generally good referencing/style. Unclear referencing/style Lacks consistency with many errors. Presentation Proper writing. Professionally presented. Properly written, with some minor deficiencies. Mostly good, but some structure or presentation problems. Acceptable presentation. Poor structure, careless presentation.

len1651655

9/21/2017 2:15:57 AM

Marking Rubrics: Grade Mark HD 80%+ D 70%-79% CR 60%-69% P 50%-59% Fail < 50% Excellent Very Good Good Satisfactory Unsatisfactor y Analysis Logic is clear and easy to follow with strong arguments. Consistency logical and convincing. Mostly consistent and convincing. Adequate cohesion and conviction. Argument is confused and disjointed. Effort/Difficulties/ Challenges The presented solution demonstrated an extreme degree of difficulty that would require an expert to implement. The presented solution demonstrated a high degree of difficulty that would be an advance professional to implement. The presented solution demonstrated an average degree of difficulty that would be an average professional to implement. The presented solution demonstrated a low degree of difficulty that would be easy to implement. The presented solution demonstrated a poor degree of difficulty that would be too easy to implement.

len1651655

9/21/2017 2:15:46 AM

Carrier wave for state 1 plot Subplots showing In-phase, Quadrature and resulting waves. 6 Carrier wave for state 2 plot Subplots showing In-phase, Quadrature and resulting waves. 6 Carrier wave for state 3 plot Subplots showing In-phase, Quadrature and resulting waves. 6 Carrier wave for state 4 plot Subplots showing In-phase, Quadrature and resulting waves. 6 Data encoding Input data correctly broken down into bit groups. 1 Carrier wave for modulated data plot Plot resulting carrier wave corresponding to the input data. 6 Reference style Follow IEEE reference style. 1   Total  40 

len1651655

9/21/2017 2:15:30 AM

Marking Criteria: Section to be included in the  report and demonstration  Description of the section  Marks  Introduction, Method, Results, and Discussion Each section is present in the report and adequately covered. 4 QPSK constellation diagram Correct number of bits assigned for each state. 2 In-phase and Quadrature components Correct In-phase and Quadrature waves assigned for each state. 2

len1651655

9/21/2017 2:15:09 AM

Please read marking criteria and marking rubrics thoroughly before writing a report. and please cooperate when we ask to recheck the assignment because I got less marks in last assignment due to wrong results of matlab. 1. All work must be submitted on Moodle by the due date along with a completed Assignment Cover Page. 2. The assignment must be submitted in only MS Word format, 1.5 spacing, 10-pt Times New Roman (Body) font and 2 cm margins on all four sides of each page with appropriate section headings and page numbering. 3. All materials used must be cited in the text of the report, and listed appropriately at the end in a reference list using IEEE referencing style.

Write a Review

MATLAB Programming Questions & Answers

  Finite difference method

Use the finite difference method to calculate the temperature at the point specified since it is easier.

  Determine the necessary shell temperature

In a shell-and-tube heat exchanger, one fluid passes through a central tube while another fluid flows through an outer shell in the opposite direction. The purpose is to heat the fluid passing through the central tube.

  Find the integral of a function at an arbitrary location

Write a Matlab function to perform numerical integration of a set of evenly spaced data points using the trapezoidal rule

  Compute the speed of single-stage planetary gear train

Write a MATLAB function [speed] = planetary (N, emesh, first, last, arm) that computes the speed of a given link in a single-stage planetary gear train.

  Calculate and plot the error in the numerical derivative

Write a program to calculate and plot the error in the numerical estimate of the derivative.

  Create the graph using matlab functions

Create the graph, which contains a piecewise function where a line exists in the first interval, a parabola in the second interval, and the sine function in the third interval.

  Develop a simulation program

Develop a simulation program

  Create a vector in matlab

Create a three dimensional diagram of function.

  Open a named pipe and to read data from the pipe

Open a named pipe and to read data from the pipe in matlab

  Write the commands that will create the matrix

Write the commands that will create the matrix.

  Lagrange interpolating polynomial of degree

Lagrange interpolating polynomial of degree

Free Assignment Quote

Assured A++ Grade

Get guaranteed satisfaction & time on delivery in every assignment order you paid with us! We ensure premium quality solution document along with free turntin report!

All rights reserved! Copyrights ©2019-2020 ExpertsMind IT Educational Pvt Ltd