Reference no: EM132246975
Applied Statistics Assignment -
Q1. Compute the critical value zα/2 that corresponds to a 87% level of confidence.
Q2. Determine the point estimate of the population proportion, the margin of error for the following confidence interval, and the number of individuals in the sample with the specified characteristic, x, for the sample size provided.
Lower bound = 0.211, upper bound = 0.779, n = 1000
The point estimate of the population proportion is _________. (Round to the nearest thousandth as needed.)
The margin of error is _________. (Round to the nearest thousandth as needed.)
The number of individuals in the sample with the specified characteristic is _________ (Round to the nearest integer as needed.)
Q3. Construct a confidence interval of the population proportion at the given level of confidence.
x = 120, n = 1200, 90% confidence
The lower bound of the confidence interval is _________ . (Round to three decimal places as needed.)
The upper bound of the confidence interval is _________ . (Round to three decimal places as needed.)
Q4. In a survey of 2065 adults in a certain country conducted during a period of economic uncertainty, 65% thought that wages paid to workers in industry were too low. The margin of error was 3 percentage points with 95% confidence. For parts (a) through (d) below, which represent a reasonable interpretation of the survey results? For those that are not reasonable, explain the flaw.
(a) We are 95% confident 65% of adults in the country during the period of economic uncertainty felt wages paid to workers in industry were too low.
Is the interpretation reasonable?
A. The interpretation is reasonable.
B. The interpretation is flawed. The interpretation suggests that this interval sets the standard for all the other intervals, which is not true.
C. The interpretation is flawed. The interpretation indicates that the level of confidence is varying.
D. The interpretation is flawed. The interpretation provides no interval about the population proportion.
(b) We are 92% to 98% confident 65% of adults in the country during the period of economic uncertainty felt wages paid to workers in industry were too low.
Is the interpretation reasonable?
A. The interpretation is reasonable.
B. The interpretation is flawed. The interpretation indicates that the level of confidence is varying.
C. The interpretation is flawed. The interpretation suggests that this interval sets the standard for all the other intervals, which is not true.
D. The interpretation is flawed. The interpretation provides no interval about the population proportion.
(c) We are 95% confident that the interval from 0.62 to 0.68 contains the true proportion of adults in the country during the period of economic uncertainty who believed wages paid to workers in industry were too low.
Is the interpretation reasonable?
A. The interpretation is reasonable.
B. The interpretation is flawed. The interpretation suggests that this interval sets the standard for all the other intervals, which is not true.
C. The interpretation is flawed. The interpretation indicates that the level of confidence is varying.
D. The interpretation is flawed. The interpretation provides no interval about the population proportion.
(d) In 95% of samples of adults in the country during the period of economic uncertainty, the proportion who believed wages paid to workers in industry were too low is between 0.62 and 0.68.
Is the interpretation reasonable?
A. The interpretation is reasonable.
B. The interpretation is flawed. The interpretation provides no interval about the population proportion.
C. The interpretation is flawed. The interpretation indicates that the level of confidence is varying.
D. The interpretation is flawed. The interpretation suggests that this interval sets the standard for all the other intervals, which is not true.
Q5. A survey of 2294 adults in a certain large country aged 18 and older conducted by a reputable polling organization found that 401 have donated blood in the past two years. Complete parts (a) through (c) below.
(a) Obtain a point estimate for the population proportion of adults in the country aged 18 and older who have donated blood in the past two years.
p^ = ________ (Round to three decimal places as needed.)
(b) Verify that the requirements for constructing a confidence interval about p are satisfied.
The sample (1) ________ a simple random sample, the value of (2) ________ is, which is (3) ________ 10, and the (4) ________ (5) ________ less than or equal to 5% of the (6) ________. (Round to three decimal places as needed.)
(c) Construct and interpret a 90% confidence interval for the population proportion of adults in the country who have donated blood in the past two years. Select the correct choice below and fill in any answer boxes within your choice. (Type integers or decimals rounded to three decimal places as needed. Use ascending order.)
A. We are ________ % confident the proportion of adults in the country aged 18 and older who have donated blood in the past two years is between ________ and ________.
B. There is a ________ % chance the proportion of adults in the country aged 18 and older who have donated blood in the past two years is between ________ and________.
(1) is stated to not be, cannot be assumed to be, can be assumed to be, is stated to be.
(2) n, p^(1 - p^), np^(1 - p^), np^
(3) less than, greater than or equal to.
(4) sample size, population proportion, population size, sample proportion.
(5) cannot be assumed to be, is stated to be, is stated to not be, can be assumed to be.
(6) population size, population proportion, sample proportion, sample size.
Q6. A group conducted a poll of 2066 likely voters just prior to an election. The results of the survey indicated that candidate A would receive 49% of the popular vote and candidate B would receive 45% of the popular vote. The margin of error was reported to be 4%. The group reported that the race was too close to call. Use the concept of a confidence interval to explain what this means.
What does it mean to say the race was too close to call?
A. The margin of error suggests candidate A may receive between 45% and 53% of the popular vote and candidate B may receive between 41% and 49% of the popular vote. Because the poll estimates overlap when accounting for margin of error, the poll cannot predict the winner.
B. Since the poll results do not show that one of the candidates has more than 50% of the popular vote, the poll cannot predict the winner.
C. Since the estimated proportions depend on the level of confidence, the candidate predicted to receive the greater percentage of the popular vote changes for different levels of confidence, so the poll cannot predict the winner.
D. Since the difference between the percentages of the popular vote for the candidates is less than the 6% of voters that are undecided, the poll cannot predict the winner.
Q7. A researcher wishes to estimate the proportion of adults who have high-speed Internet access. What size sample should be obtained if she wishes the estimate to be within 0.03 with 95% confidence if
(a) she uses a previous estimate of 0.32?
(b) she does not use any prior estimates?
(a) n = _____ (Round up to the nearest integer.)
(b) n = _____ (Round up to the nearest integer.)
Q8. Determine the t-value in each of the cases.
View the table of areas under the t-distribution in attached file.
(a) Find the t-value such that the area in the right tail is 0.01 with 8 degrees of freedom.
(b) Find the t-value such that the area in the right tail is 0.15 with 9 degrees of freedom.
(c) Find the t-value such that the area left of the t-value is 0.10 with 21 degrees of freedom. [Hint: Use symmetry.]
(d) Find the critical t-value that corresponds to 60% confidence. Assume 9 degrees of freedom.
Q9. Determine the point estimate of the population mean and margin of error for the confidence interval.
Lower bound is 17, upper bound is 29.
The point estimate of the population mean is _________.
The margin of error for the confidence interval is _________.
Q10. In a survey, 1500 adults in a certain country were asked how many hours they worked in the previous week. Based on the results, a 95% confidence interval for mean number of hours worked was lower bound: 38.4 and upper bound: 40.1. Which of the following represents a reasonable interpretation of the result? For those that are not reasonable, explain the flaw. Complete parts (a) through (d) below.
(a) There is a 95% chance the mean number of hours worked by adults in this country in the previous week was between 38.4 hours and 40.1 hours.
A. Flawed. This interpretation implies that the mean is only for last week.
B. Correct. This interpretation is reasonable.
C. Flawed. This interpretation makes an implication about individuals rather than the mean.
D. Flawed. This interpretation implies that the population mean varies rather than the interval.
(b) We are 95% confident that the mean number of hours worked by adults in this country in the previous week was between 38.4 hours and 40.1 hours.
A. Flawed. This interpretation makes an implication about individuals rather than the mean.
B. Flawed. This interpretation implies that the population mean varies rather than the interval.
C. Flawed. This interpretation does not make it clear that the 95% is the probability that the mean is within the interval.
D. Correct. This interpretation is reasonable.
(c) 95% of adults in this country worked between 38.4 hours and 40.1 hours last week.
A. Correct. This interpretation is reasonable.
B. Flawed. This interpretation makes an implication about individuals rather than the mean.
C. Flawed. This interpretation implies that the mean is only for last week.
D. Flawed. This interpretation does not make it clear that the 95% is the probability that the mean is within the interval.
(d) We are 95% confident that the mean number of hours worked by adults in a particular area of this country in the previous week was between 38.4 hours and 40.1 hours.
A. Flawed. This interpretation implies that the population mean varies rather than the interval.
B. Flawed. The interpretation should be about the mean number of hours worked by adults in the whole country, not about adults in the particular area.
C. Correct. This interpretation is reasonable.
D. Flawed. This interpretation makes an implication about individuals rather than the mean.
Q11. A nutritionist wants to determine how much time nationally people spend eating and drinking. Suppose for a random sample of 1093 people age 15 or older, the mean amount of time spent eating or drinking per day is 1.26 hours with a standard deviation of 0.55 hour. Complete parts (a) through (d) below.
(a) A histogram of time spent eating and drinking each day is skewed right. Use this result to explain why a large sample size is needed to construct a confidence interval for the mean time spent eating and drinking each day.
A. Since the distribution of time spent eating and drinking each day is normally distributed, the sample must be large so that the distribution of the sample mean will be approximately normal.
B. The distribution of the sample mean will never be approximately normal.
C. Since the distribution of time spent eating and drinking each day is not normally distributed (skewed right), the sample must be large so that the distribution of the sample mean will be approximately normal.
D. The distribution of the sample mean will always be approximately normal.
(b) In 2010, there were over 200 million people nationally age 15 or older. Explain why this, along with the fact that the data were obtained using a random sample, satisfies the requirements for constructing a confidence interval.
A. The sample size is less than 5% of the population.
B. The sample size is less than 10% of the population.
C. The sample size is greater than 10% of the population.
D. The sample size is greater than 5% of the population.
(c) Determine and interpret a 99% confidence interval for the mean amount of time Americans age 15 or older spend eating and drinking each day.
Select the correct choice below and fill in the answer boxes, if applicable, in your choice. (Type integers or decimals rounded to three decimal places as needed. Use ascending order.)
A. The nutritionist is 99% confident that the mean amount of time spent eating or drinking per day is between _______ and_______ hours.
B. There is a 99% probability that the mean amount of time spent eating or drinking per day is between _______ and _______hours.
C. The nutritionist is 99% confident that the amount of time spent eating or drinking per day for any individual is between _______ and _______hours.
D. The requirements for constructing a confidence interval are not satisfied.
(d) Could the interval be used to estimate the mean amount of time a 9-year-old spends eating and drinking each day? Explain.
A. Yes; the interval is about the mean amount of time spent eating or drinking per day for people age 15 or older and can be used to find the mean amount of time spent eating or drinking per day for 9-year-olds.
B. No; the interval is about individual time spent eating or drinking per day and cannot be used to find the mean time spent eating or drinking per day for specific age.
C. No; the interval is about people age 15 or older. The mean amount of time spent eating or drinking per day for 9-year-olds may differ.
D. Yes; the interval is about individual time spent eating or drinking per day and can be used to find the mean amount of time a 9-year-old spends eating and drinking each day.
E. A confidence interval could not be constructed in part (c).
12. A survey was conducted that asked 1028 people how many books they had read in the past year. Results indicated that x- =14.4 books and s = 18.5 books. Construct a 98% confidence interval for the mean number of books people read. Interpret the interval.
Construct a 98% confidence interval for the mean number of books people read and interpret the result. Select the correct choice below and fill in the answer boxes to complete your choice. (Use ascending order. Round to two decimal places as needed.)
A. There is a 98% chance that the true mean number of books read is between _______ and _______.
B. If repeated samples are taken, 98% of them will have a sample mean between _______ and _______.
C. There is 98% confidence that the population mean number of books read is between _______ and _______.
Q13. The data below represent the length (in miles) of a random sample of tornadoes in a specific area. This length represents the number of miles a particular tornado was on the ground.
Table of cell phone bills miles.
|
Tornado Length (in miles)
|
|
1.09
|
0.52
|
2.38
|
0.11
|
5.01
|
|
9.34
|
4.72
|
5.70
|
0.63
|
1.76
|
|
2.46
|
0.53
|
7.74
|
2.14
|
3.51
|
|
1.11
|
20.84
|
5.62
|
5.88
|
0.11
|
|
0.51
|
22.72
|
0.73
|
0.96
|
0.12
|
|
3.55
|
2.05
|
8.21
|
0.34
|
|
|
5.16
|
0.20
|
0.85
|
0.51
|
|
|
0.49
|
7.22
|
1.69
|
0.52
|
|
|
1.28
|
14.45
|
0.21
|
0.11
|
|
|
2.05
|
13.59
|
0.11
|
5.10
|
|
|
0.90
|
0.96
|
0.74
|
2.51
|
|
|
1.87
|
3.91
|
0.27
|
1.15
|
|
|
1.89
|
6.35
|
0.73
|
5.93
|
|
|
6.35
|
4.55
|
1.58
|
0.49
|
|
|
3,55
|
6.04
|
3.31
|
1.11
|
|
|
8.37
|
1.26
|
8.48
|
0.50
|
|
|
0.15
|
9.95
|
0.37
|
1.03
|
|
|
0.11
|
2.08
|
0.10
|
0.20
|
|
|
0.11
|
8.85
|
0.40
|
1.15
|
|
|
0.11
|
8.78
|
0.11
|
3.41
|
|
Use the data to complete parts (a) through (d) below.
(a) Draw a histogram of the data and comment on the shape. Choose the correct histogram below.
Comment on the shape of the histogram. Choose the correct answer below.
A. The histogram is symmetric and bell-shaped.
B. The histogram is uniform.
C. The histogram is skewed left.
D. The histogram is skewed right.
(b) Draw a boxplot of the data. Are there any outliers? Choose the correct boxplot below.
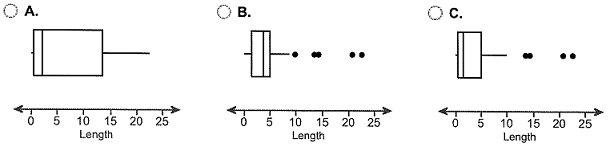
Are there outliers?
- No, because there are no values that are more extreme than Q1 or Q99.
- No, because there are no values that fall at least 1.5(IQR) outside of Q1 or Q3.
- Yes, because there are several values that are more extreme than Q1 or Q99.
- Yes, because there are several values that fall at least 1.5(IQR) outside of Q1 or Q3.
(c) Based on the results to parts (a) and (b), explain why a large sample size might be desirable to construct a confidence interval for the mean length of a tornado in this area. Choose the correct answer below.
A. The results to parts (a) and (b) indicate that the underlying population is normal. Such populations require large sample sizes to construct valid confidence intervals.
B. The results to parts (a) and (b) indicate that the sample size is small relative to the population size. Sample sizes must be large relative to the population size to construct valid confidence intervals.
C. The results to parts (a) and (b) indicate that the underlying population is non-normal. Such populations require large sample sizes to construct valid confidence intervals.
D. The results to parts (a) and (b) indicate that the sample data are not independent. Dependent samples require large sample sizes to construct valid confidence intervals.
(d) Use statistical software to construct a 90% confidence interval for the mean tornado length. Select the correct choice below and fill in the answer boxes to complete your choice. (Use ascending order. Round to two decimal places as needed.)
A. If repeated samples are taken, 90% of them will have a sample mean between _____ miles and _____ miles.
B. There is 90% probability that the true mean length of a tornado is between _____ miles and _____ miles.
C. We are 90% confident that the population mean length of a tornado is between_____ miles and _____ miles.
Q14. A doctor wants to estimate the mean HDL cholesterol of all 20- to 29-year-old females. How many subjects are needed to estimate the mean HDL cholesterol within 4 points with 99% confidence assuming s = 15.6 based on earlier studies? Suppose the doctor would be content with 95% confidence. How does the decrease in confidence affect the sample size required?
Partial Critical Value Table
|
Level of Confidence (1 - α) * 100%
|
Area in Each Tail, α/2
|
Critical Value, zα/2
|
|
90%
|
0.05
|
1.645
|
|
95%
|
0.025
|
1.96
|
|
99%
|
0.005
|
2.575
|
A 99% confidence level requires _______ subjects. (Round up to the nearest subject.)
A 95% confidence level requires _______ subjects. (Round up to the nearest subject.)
How does the decrease in confidence affect the sample size required?
A. The sample size is the same for all levels of confidence.
B. Decreasing the confidence level increases the sample size needed.
C. Decreasing the confidence level decreases the sample size needed.
Attachment:- Assignment File.rar