Reference no: EM13119728
PROBLEM 1
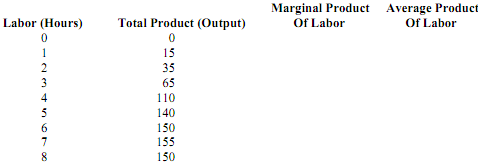
A manufacturing firm faces the following production schedules in the short run, when capital is fixed at 10 machines:

a. Complete the table above.
b. Determine the level of labor usage at which diminishing marginal returns set in.
c. Briefly explain what happens to marginal productivity when the eighth hour of labor is employed.
PROBLEM 2
The following table represents cost information for a firm operating in a perfectly competitive market. In the table, each of the terms is defined as follows: TFC is total fixed cost; TVC represents total variable cost; TC is total cost; MC is marginal cost; AVC is average variable cost; and ATC is average total cost. All costs are measured in dollars. Begin this problem by completing the table.

a. Does the table above represent short-run or long-run costs? Briefly explain your answer.
b. Find the quantity at which diminishing marginal returns set in.
c. Suppose that the market supply and demand are equilibrating at a price of $25.00. If the firm's goal is to maximize profits, will the firm choose to operate? If so, which quantity will the firm choose to produce?
PROBLEM 3
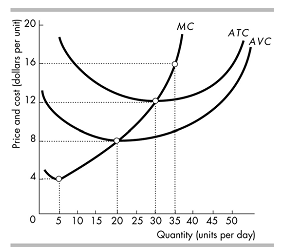
The graph below represents a firm's short-run cost curves. Suppose that the price in this market is $16.00. If the firm's goal is to maximize profits, will this firm operate or shut down in the short run? If it chooses to operate, which quantity will it choose? If this firm's cost curves are representative of the typical firm in this industry, do you expect to observe entry or exit in this market over the long run? When this process of entry or exit is complete, what will the final market price be for this product? Briefly explain your answer.

PROBLEM 4
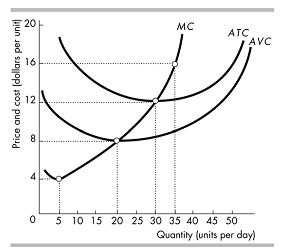
The graph below represents the short-run cost curves for a typical firm in a perfectly competitive industry. Suppose the industry is currently at its long-run equilibrium, such that firms are making economic profit of zero. Based on the graph, determine what the market price (and therefore marginal revenue) currently is. To the right of the cost graph, sketch a supply and demand graph representing the market conditions, assuming that there are 50 identical firms producing in this industry. On this graph, clearly indicate the market price and total quantity that will be sold in the market. (Assume that information on economic costs are included in the cost curves.)

PROBLEM 5
This problem is a continuation of Problem #4. Suppose this industry experiences an increase in demand; following the shift in demand, the price in the market rises to $16. On your supply-and-demand graph, illustrate this shift, and label the new demand curve "D2". Determine the profit-maximizing level of output for the typical firm. Shade the area of the cost graph that represents the typical firm's profits following this increase in demand. Are these profits positive or negative? If producers expect the new demand conditions to last for a long time, will this industry eventually experience entry or exit? Once this process of entry or exit is complete, what will the price of this product be in long-run equilibrium (assume that the cost curves do not change during this time period). Sketch a new supply curve, and label it "S2", that reflects the supply curve once the process of entry or exit is complete.
PROBLEM 6
A monopolist operates in an industry under the following demand and cost conditions.

a. Complete the table above.
b. Find the quantity at which diminishing marginal returns set in.
c. If the monopolist's goal is to maximize profits, and the monopolist charges all customers the same price, determine the optimal level of output.
d. When the monopolist chooses the profit-maximizing level of output, is demand elastic, inelastic, or unit elastic? Briefly explain your answer.
|
Illustrate what was the speeder speed
: If the police car accelerates uniformly at 3.00m/s^2 and overtakes the speeder after accelerating for 9.00 s, illustrate what was the speeder's speed?
|
|
What is the molar mass of the gas
: If 7.63 of an unknown gas occupies 79.1mL at 25.02 degrees celcius and 7.55 atm of pressure, what is the molar mass of the gas? R=0.0821
|
|
Fahrenheit and celsius temperature conversions
: Katie converts the outside temperature from degrees Fahrenheit to degrees celsius. She uses the formula below to convert the temperature.
|
|
What are these probabilities not accepting the box
: If the merchant samples the fruit, what are the probabilities of accepting a Good box, accepting a Bad box, and not accepting the box? What are these probabilities if he does not sample the fruit
|
|
Determine the optimal level of output
: Find the quantity at which diminishing marginal returns set in and if the monopolist's goal is to maximize profits, and the monopolist charges all customers the same price, determine the optimal level of output.
|
|
Error in radius and error in volume
: The top of a tower is a sphere with a diameter of 40ft. A layer of paint 0.08 inches thick is applied to the sphere. Approximate the volume of the paint that is used.
|
|
Estimate the value of the equilibrium constant
: Estimate the value of the equilibrium constant at 610K for each of the following reactions. Delta Hf and S for BrCl is 14.6 kj/mol and 240.0 J/mol*K , respectively. Br2(g)+ Cl2(g) --> 2BrCl(g)
|
|
Linear and quadratic trend lines
: From 1997 through 2004, the value of US exports to Mexico was as shown below. Data are in billions of dollars. Fit a linear trend equation to the time series. Using this equation, determine the trend estimate for 2012.
|
|
The probabilities that the sample contains 4 defective screw
: Control A certain machine that is used to manufacture screws produces a defect rate of .01. A random sample of 20 screws is selected.
|