Reference no: EM132246912
Applied Statistics Assignment -
Q1. The null and alternative hypotheses are given. Determine whether the hypothesis test is left-tailed, right-tailed, or two-tailed. What parameter is being tested?
H0: σ = 6
H1: σ ≠ 6
What type of test is being conducted in this problem?
- Left-tailed test
- Right-tailed test
- Two-tailed test
What parameter is being tested?
- Population standard deviation
- Population proportion
- Population mean
Q2. For students who first enrolled in two year public institutions in a recent semester, the proportion who earned a bachelor's degree within six years was 0.395. The president of a certain college believes that the proportion of students who enroll in her institution have a higher completion rate.
(a) Determine the null and alternative hypotheses.
(b) Explain what it would mean to make a Type I error.
(c) Explain what it would mean to make a Type II error.
(a) State the hypotheses.
H0: (1) ________ (2) ________
H1: (3) ________ (4) ________
(Type integers or decimals. Do not round.)
(b) Which of the following is a Type I error?
A. The president fails to reject the hypothesis that the proportion of students who earn a bachelor's degree within six years is 0.395, when, in fact, the proportion is greater than 0.395.
B. The president rejects the hypothesis that the proportion of students who earn a bachelor's degree within six years is 0.395, when, in fact, the proportion is 0.395.
C. The president rejects the hypothesis that the proportion of students who earn a bachelor's degree within six years is 0.395, when, in fact, the proportion is greater than 0.395.
D. The president fails to reject the hypothesis that the proportion of students who earn a bachelor's degree within six years is 0.395, when, in fact, the proportion is 0.395.
(c) Which of the following is a Type II error?
A. The president fails to reject the hypothesis that the proportion of students who earn a bachelor's degree within six years is 0.395, when, in fact, the proportion is greater than 0.395.
B. The president rejects the hypothesis that the proportion of students who earn a bachelor's degree within six years is 0.395, when, in fact, the proportion is greater than 0.395.
C. The president fails to reject the hypothesis that the proportion of students who earn a bachelor's degree within six years is 0.395, when, in fact, the proportion is 0.395.
D. The president rejects the hypothesis that the proportion of students who earn a bachelor's degree within six years is 0.395, when, in fact, the proportion is 0.395.
(1) p, σ, μ
(2) >, <, ≠, =
(3) μ, σ, p
(4) =, <, >, ≠
Q3. Three years ago, the mean price of an existing single-family home was $243,782. A real estate broker believes that existing home prices in her neighborhood are higher.
(a) Determine the null and alternative hypotheses.
(b) Explain what it would mean to make a Type I error.
(c) Explain what it would mean to make a Type II error.
(a) State the hypotheses.
H0: (1) _______ (2) _______
H1: (3) _______ (4) _______
(Type integers or decimals. Do not round. Do not include the $ symbol in your answer.)
(b) Which of the following is a Type I error?
A. The broker rejects the hypothesis that the mean price is $243,782, when it is the true mean cost.
B. The broker fails to reject the hypothesis that the mean price is $243,782, when the true mean price is greater than $243,782.
C. The broker rejects the hypothesis that the mean price is $243,782, when the true mean price is greater than $243,782.
D. The broker fails to reject the hypothesis that the mean price is $243,782, when it is the true mean cost.
(c) Which of the following is a Type II error?
A. The broker rejects the hypothesis that the mean price is $243,782, when the true mean price is greater than $243,782.
B. The broker fails to reject the hypothesis that the mean price is $243,782, when it is the true mean cost.
C. The broker fails to reject the hypothesis that the mean price is $243,782, when the true mean price is greater than $243,782.
D. The broker rejects the hypothesis that the mean price is $243,782, when it is the true mean cost.
(1) p, σ, μ
(2) >, ≠, =, <
(3) p, μ, σ
(4) >, <, =, ≠
Q4. Suppose the null hypothesis is not rejected. State the conclusion based on the results of the test.
Six years ago, 11.6% of registered births were to teenage mothers. A sociologist believes that the percentage has increased since then.
Which of the following is the correct conclusion?
A. There is sufficient evidence to conclude that the percentage of teenage mothers has remained the same.
B. There is sufficient evidence to conclude that the percentage of teenage mothers has increased.
C. There is not sufficient evidence to conclude that the percentage of teenage mothers has remained the same.
D. There is not sufficient evidence to conclude that the percentage of teenage mothers has increased.
Q5. State the conclusion based on the results of the test.
According to the Federal Housing Finance Board, the mean price of a single-family home two years ago was $299,100. A real estate broker believes that because of the recent credit crunch, the mean price has decreased since then. The null hypothesis is not rejected.
Choose the correct answer below.
A. There is not sufficient evidence to conclude that the mean price of a single-family home has increased from its level two years ago of $299,100.
B. There is not sufficient evidence to conclude that the mean price of a single-family home has decreased from its level two years ago of $299,100.
C. There is sufficient evidence to conclude that the mean price of a single-family home has increased from its level two years ago of $299,100.
D. There is sufficient evidence to conclude that the mean price of a single-family home has decreased from its level two years ago of $299,100.
Q6. Test the hypothesis using the P-value approach. Be sure to verify the requirements of the test.
H0: p = 0.1 versus H1: p > 0.1
n = 200; x=25, α = 0.01
Is np0(1 - p0) ≥ 10?
Use technology to find the P-value.
(1) _________ the null hypothesis, because the P-value is (2) ______ than α.
(1) Do not reject, Reject
(2) greater, less
Q7. Test the hypothesis using the P-value approach. Be sure to verify the requirements of the test.
H0: p = 0.58 versus H1: p < 0.58
n = 150, x=78, α = 0.1
Is np0(1 - p0) ≥ 10?
Use technology to find the P-value.
(1) _________ because the P-value is (2) _______ than α.
(1) Do not reject the null hypothesis, Reject the null hypothesis
(2) greater, less
Q8. In a clinical trial, 29 out of 861 patients taking a prescription drug daily complained of flulike symptoms. Suppose that it is known that 2.8% of patients taking competing drugs complain of flulike symptoms. Is there sufficient evidence to conclude that more than 2.8% of this drug's users experience flulike symptoms as a side effect at the α = 0.01 level of significance?
Because np0(1 - p0) = ________ (1) ________ 10, the sample size is (2) ________ 5% of the population size, and the sample (3) ________ the requirements for testing the hypothesis (4) ________ satisfied. (Round to one decimal place as needed.)
What are the null and alternative hypotheses?
H0: (5) ________ (6) ________ versus H1: (7) ________ (8) ________ (Type integers or decimals. Do not round.)
Find the test statistic, z0.
Find the P-value.
Choose the correct conclusion below.
A. Since P-value < α, reject the null hypothesis and conclude that there is sufficient evidence that more than 2.8% of the users experience flulike symptoms.
B. Since P-value > α, do not reject the null hypothesis and conclude that there is not sufficient evidence that more than 2.8% of the users experience flulike symptoms.
C. Since P-value < α, do not reject the null hypothesis and conclude that there is sufficient evidence that more than 2.8% of the users experience flulike symptoms.
D. Since P-value > α, reject the null hypothesis and conclude that there is not sufficient evidence that more than 2.8% of the users experience flulike symptoms.
(1) =, ≠, >, <
(2) greater than, less than
(3) can be reasonably assumed to be random, is given to not be random, cannot be reasonably assumed to be random, is given to be random
(4) are not, are
(5) σ, p, μ
(6) >, =, <, ≠
(7) σ, p, μ
(8) ≠, =, <, >
Q9. Several years ago, 39% of parents who had children in grades K-12 were satisfied with the quality of education the students receive. A recent poll asked 1,045 parents who have children in grades K-12 if they were satisfied with the quality of education the students receive. Of the 1,045 surveyed, 466 indicated that they were satisfied. Construct a 95% confidence interval to assess whether this represents evidence that parents' attitudes toward the quality of education have changed.
What are the null and alternative hypotheses?
H0: p(1)_______ versus H1: p(2) ________. (Round to two decimal places as needed.)
Use technology to find the 95% confidence interval.
The lower bound is ________.
The upper bound is ________.
What is the correct conclusion?
A Since the interval contains the proportion stated in the null hypothesis, there is insufficient evidence that parents' attitudes toward the quality of education have changed.
B. Since the interval does not contain the proportion stated in the null hypothesis, there is sufficient evidence that parents' attitudes toward the quality of education have changed.
C. Since the interval contains the proportion stated in the null hypothesis, there is sufficient evidence that parents' attitudes toward the quality of education have changed.
D. Since the interval does not contain the proportion stated in the null hypothesis, there is insufficient evidence that parents' attitudes toward the quality of education have changed.
(1) =, <, >, ≠
(2) >, <, ≠, =
Q10. Suppose a researcher is testing the hypothesis H0: p = 0.4 versus H1: p ≠ 0.4 and she finds the P-value to be 0.29. Explain what this means. Would she reject the null hypothesis? Why?
Choose the correct explanation below.
A. If the P-value for a particular test statistic is 0.29, she expects results at least as extreme as the test statistic in about 29 of 100 samples if the null hypothesis is true.
B. If the P-value for a particular test statistic is 0.29, she expects results no more extreme than the test statistic in exactly 29 of 100 samples if the null hypothesis is true.
C. If the P-value for a particular test statistic is 0.29, she expects results at least as extreme as the test statistic in exactly 29 of 100 samples if the null hypothesis is true.
D. If the P-value for a particular test statistic is 0.29, she expects results no more extreme than the test statistic in about 29 of 100 samples if the null hypothesis is true.
Choose the correct conclusion below.
A. Since this event is unusual, she will reject the null hypothesis.
B. Since this event is unusual, she will not reject the null hypothesis.
C. Since this event is not unusual, she will reject the null hypothesis.
D. Since this event is not unusual, she will not reject the null hypothesis.
Q11. Based on interviews with 80 SARS patients, researchers found that the mean incubation period was 4.2 days, with a standard deviation of 14.6 days. Based on this information, construct a 95% confidence interval for the mean incubation period of the SARS virus. Interpret the interval.
The lower bound is _________ days. (Round to two decimal places as needed.)
The upper bound is _________ days. (Round to two decimal places as needed.)
Interpret the interval. Choose the correct answer below.
A. There is 95% confidence that the mean incubation period is greater than the upper bound of the interval
B. There is 95% confidence that the mean incubation period is less than the lower bound of the interval.
C. There is a 95% probability that the mean incubation period lies between the lower and upper bounds of the interval.
D. There is 95% confidence that the mean incubation period lies between the lower and upper bounds of the interval.
Q12. To test H0: μ = 20 versus H1: μ < 20, a simple random sample of size n = 20 is obtained from a population that is known to be normally distributed. Answer parts (a)-(d).
View the t-Distribution Area in Right Tail in attached file.
(a) If x- = 18.3 and s = 3.9, compute the test statistic.
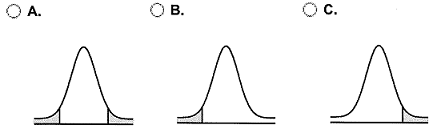
(b) Draw a t-distribution with the area that represents the P-value shaded. Which of the following graphs shows the correct shaded region?
(c) Approximate the P-value. Choose the correct range for the P-value below.
A. 0.05 < P-value < 0.10
B. 0.025 < P-value < 0.05
C. 0.10 < P-value < 0.15
D. 0.15 < P-value < 0.20
(d) If the researcher decides to test this hypothesis at the α = 0.05 level of significance, will the researcher reject the null hypothesis?
A. The researcher will not reject the null hypothesis since the P-value is not less than α.
B. The researcher will reject the null hypothesis since the P-value is less than α.
C. The researcher will not reject the null hypothesis since the P-value is less than α.
D. The researcher will reject the null hypothesis since the P-value is not less than α.
Q13. It has long been stated that the mean temperature of humans is 98.6oF. However, two researchers currently involved in the subject thought that the mean temperature of humans is less than 98.6oF. They measured the temperatures of 67 healthy adults 1 to 4 times daily for 3 days, obtaining 300 measurements. The sample data resulted in a sample mean of 98.4oF and a sample standard deviation of 1.1oF. Use the P-value approach to conduct a hypothesis test to judge whether the mean temperature of humans is less than 98.6oF at the α = 0.01 level of significance.
State the hypotheses.
H0: (1) _______ (2) _______ 98.6oF
H1: (3) _______ (4) _______ 98.6oF
Find the test statistic.
t0 = _______ (Round to two decimal places as needed.)
The P-value is _______. (Round to three decimal places as needed.)
What can be concluded?
A. Reject H0 since the P-value is not less than the significance level.
B. Do not reject H0 since the P-value is not less than the significance level.
C. Reject H0 since the P-value is less than the significance level.
D. Do not reject H0 since the P-value is less than the significance level.
(1) p, μ, σ
(2) <, >, =, ≠
(3) μ, σ, p
(4) =, >, ≠, <
Q14. A golf association requires that golf balls have a diameter that is 1.68 inches. To determine if golf balls conform to the standard, a random sample of golf balls was selected. Their diameters are shown in the accompanying data table. Do the golf balls conform to the standards? Use the α = 0.05 level of significance.
Data Table
|
Golf Ball Diameter (inches)
|
|
1.682
|
1.677
|
1.681
|
|
1.685
|
1.678
|
1.686
|
|
1.684
|
1.684
|
1.673
|
|
1.685
|
1.682
|
1.675
|
First determine the appropriate hypotheses.
H0: (1) ______ (2) ______
H1: (3) ______ (4) ______
Find the test statistic.
Find the P-value.
What can be concluded from the hypothesis test?
A. Do not reject H0. There is sufficient evidence to conclude that the golf balls do not conform to the association's standards at the α = 0.05 level of significance.
B. Reject H0. There is not sufficient evidence to conclude that the golf balls do not conform to the association's standards at the α = 0.05 level of significance.
C. Reject H0. There is sufficient evidence to conclude that the golf balls do not conform to the association's standards at the α = 0.05 level of significance.
D. Do not reject H0. There is not sufficient evidence to conclude that the golf balls do not conform to the association's standards at the α = 0.05 level of significance.
(1) μ, p, σ
(2) =, >, >, ≠
(3) μ, σ, p
(4) <, =, >, ≠
Q15. Calcium is essential to tree growth because it promotes the formation of wood and maintains cell walls. In 1990, the concentration of calcium in precipitation in a certain area was 0.15 milligrams per liter (mg/L). A random sample of 10 precipitation dates in 2007 results in the following data table.
Data Table
|
0.062
|
0.079
|
0.076
|
0.278
|
0.114
|
|
0.173
|
0.106
|
0.214
|
0.337
|
0.117
|
Complete parts (a) through (c) below.
(a) State the hypotheses for determining if the mean concentration of calcium precipitation has changed since 1990.
H0: (1) ______ (2) ______ 0.15 mg/L
H1: (3) ______ (4) ______ 0.15 mg/L
(b) Construct a 95% confidence interval about the sample mean concentration of calcium precipitation.
The lower bound is ______.
The upper bound is ______.
(c) Does the sample evidence suggest that calcium concentrations have changed since 1990?
A. No, because the confidence interval contains 0.15 mg/L.
B. No, because the confidence interval does not contain 0.15 mg/L.
C. Yes, because the confidence interval contains 0.15 mg/L.
D. Yes, because the confidence interval does not contain 0.15 mg/L.
(1) μ, p, σ
(2) =, ≠, <, >
(3) μ, σ, p
(4) <, =, ≠, >
Attachment:- Assignment File.rar