Reference no: EM132246993
Applied Statistics Assignment -
Q1. A study was conducted that resulted in the following relative frequency histogram. Determine whether or not the histogram indicates that a normal distribution could be used as a model for the variable.
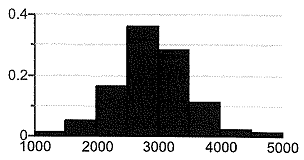
Choose the correct answer below.
A. The histogram is not bell-shaped, so a normal distribution could not be used as a model for the variable.
B. The histogram is bell-shaped, so a normal distribution could be used as a model for the variable.
C. The histogram is bell-shaped, so a normal distribution could not be used as a model for the variable.
D. The histogram is not bell-shaped, so a normal distribution could be used as a model for the variable.
Q2. The relative frequency histogram represents the length of phone calls on George's cell phone during the month of September. Determine whether or not the histogram indicates that a normal distribution could be used as a model for the variable.
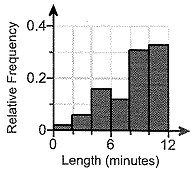
Can a normal distribution be used as a model for the variable?
A. No, because the histogram does not have the shape of a normal curve.
B. Yes, because the histogram has the shape of a normal curve.
C. Yes, because the histogram is not symmetric about its mean.
D. No, because the histogram has the shape of a normal curve.
E. Yes, because the histogram does not have the shape of a normal curve.
Q3. Suppose the lengths of human pregnancies are normally distributed with μ = 266 days and σ = 16 days. Complete parts (a) and (b) below.
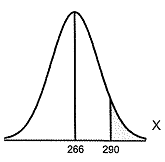
(a) The figure represents the normal curve with μ = 266 days and σ =16 days. The area to the right of X = 290 is 0.0668. Provide two interpretations of this area.
Provide one interpretation of the area. Select the correct choice below and fill in the answer boxes to complete your choice. (Type integers or decimals. Do not round.)
A. The proportion of human pregnancies that last more than 290 days is ________.
B. The proportion of human pregnancies that last less than days is ________.
Provide a second interpretation of the area. Select the correct choice below and fill in the answer boxes to complete your choice. (Type integers or decimals. Do not round.)
A. The probability that a randomly selected human pregnancy lasts less than days is ________.
B. The probability that a randomly selected human pregnancy lasts more than 290 days is ________.
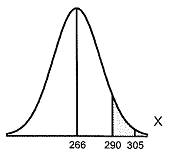
(b) The above figure represents the normal curve with μ = 266 days and σ = 16 days. The area between x = 290 and x = 305 is 0.0594. Provide two interpretations of this area.
Provide one interpretation of the area. Select the correct choice below and fill in the answer boxes to complete your choice. (Type integers or decimals. Do not round. Use ascending order.)
A. The proportion of human pregnancies that last between 290 and 305 days is ________.
B. The proportion of human pregnancies that last less than or more than days is _____.
Provide a second interpretation of the area. Select the correct choice below and fill in the answer boxes to complete your choice. (Type integers or decimals. Do not round. Use ascending order.)
A. The probability that a randomly selected human pregnancy lasts less than or more than days is _________.
B. The probability that a randomly selected human pregnancy lasts between 290 and 305 days is ________.
Q4. Determine the area under the standard normal curve that lies to the left of (a) Z = - 0.72, (b) Z = - 0.75, (c) Z = - 0.77, and (d) Z = -1.31.
(a) The area to the left of Z = - 0.72 is ________.
(b) The area to the left of Z = - 0.75 is ________.
(c) The area to the left of Z = - 0.77 is ________.
(d) The area to the left of Z = - 1.31 is ________.
Q5. Determine the area under the standard normal curve that lies between (a) Z = - 1.78 and Z = 1.78, (b) Z = - 2.44 and Z = 0, and (c) Z = 0.18 and Z = 1.32.
(a) The area that lies between Z = - 1.78 and Z = 1.78 is ________.
(b) The area that lies between Z = - 2.44 and Z = 0 is ________.
(c) The area that lies between Z = 0.18 and Z = 1.32 is ________.
Q6. Determine the total area under the standard normal curve in parts (a) through (c) below.
(a) Find the area under the normal curve to the left of z = -1 plus the area under the normal curve to the right of z = 1.
(b) Find the area under the normal curve to the left of z = - 1.54 plus the area under the normal curve to the right of z = 2.54.
(c) Find the area under the normal curve to the left of z = - 0.28 plus the area under the normal curve to the right of z =1.30.
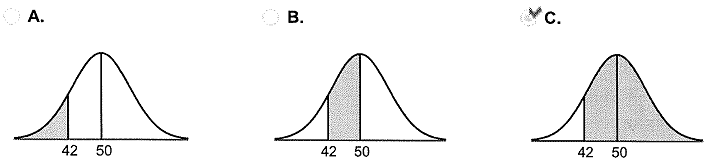
Q7. Assume the random variable X is normally distributed with mean μ = 50 and standard deviation σ = 7. Compute the probability. Be sure to draw a normal curve with the area corresponding to the probability shaded.
P(X > 42)
Which of the following normal curves corresponds to P(X > 42)?
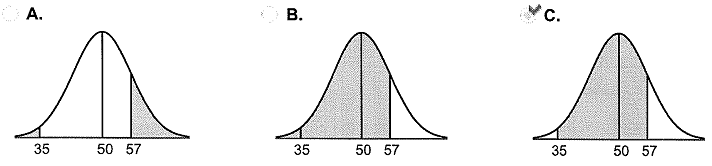
Q8. Assume the random variable X is normally distributed with mean μ = 50 and standard deviation σ = 7. Compute the probability. Be sure to draw a normal curve with the area corresponding to the probability shaded.
P(35 < X < 57)
Which of the following normal curves corresponds to P(35 < X < 57)?
Q9. Suppose that the lifetimes of light bulbs are approximately normally distributed, with a mean of 56 hours and a standard deviation of 3.2 hours. With this information, answer the following questions.
(a) What proportion of light bulbs will last more than 61 hours?
(b) What proportion of light bulbs will last 50 hours or less?
(c) What proportion of light bulbs will last between 57 and 62 hours?
(d) What is the probability that a randomly selected light bulb lasts less than 45 hours?
Q10. Determine μx^- and σx^- from the given parameters of the population and sample size.
μ = 70, σ = 32, n = 64
Q11. Suppose the lengths of the pregnancies of a certain animal are approximately normally distributed with mean μ =172 days and standard deviation σ =17 days. Complete parts (a) through (f) below.
(a) What is the probability that a randomly selected pregnancy lasts less than 166 days?
Interpret this probability. Select the correct choice below and fill in the answer box within your choice. (Round to the nearest integer as needed.)
A. If 100 pregnant individuals were selected independently from this population, we would expect pregnancies to last more than 166 days.
B. If 100 pregnant individuals were selected independently from this population, we would expect pregnancies to last exactly 166 days.
C. If 100 pregnant individuals were selected independently from this population, we would expect 36 pregnancies to last less than 166 days.
(b) Suppose a random sample of 18 pregnancies is obtained. Describe the sampling distribution of the sample mean length of pregnancies.
(c) What is the probability that a random sample of 18 pregnancies has a mean gestation period of 166 days or less?
Interpret this probability. Select the correct choice below and fill in the answer box within your choice. (Round to the nearest integer as needed.)
A. If 100 independent random samples of size n =18 pregnancies were obtained from this population, we would expect ________ sample(s) to have a sample mean of 166 days or more.
B. If 100 independent random samples of size n = 18 pregnancies were obtained from this population, we would expect ________ sample(s) to have a sample mean of 166 days or less.
C. If 100 independent random samples of size n = 18 pregnancies were obtained from this population, we would expect ________ sample(s) to have a sample mean of exactly 166 days.
(d) What is the probability that a random sample of 56 pregnancies has a mean gestation period of 166 days or less?
Interpret this probability. Select the correct choice below and fill in the answer box within your choice. (Round to the nearest integer as needed.)
A. If 100 independent random samples of size n = 56 pregnancies were obtained from this population, we would expect ________ sample(s) to have a sample mean of exactly 166 days.
B. If 100 independent random samples of size n = 56 pregnancies were obtained from this population, we would expect ________ sample(s) to have a sample mean of 166 days or more.
C. If 100 independent random samples of size n = 56 pregnancies were obtained from this population, we would expect ________ sample(s) to have a sample mean of 166 days or less.
(e) What might you conclude if a random sample of 56 pregnancies resulted in a mean gestation period of 166 days or less?
This result would be (1) ________so the sample likely came from a population whose mean gestation period is (2) ________172 days.
(f) What is the probability a random sample of size 15 will have a mean gestation period within 12 days of the mean?
(1) unusual, expected
(2) greater than, equal to, less than
Q12. The shape of the distribution of the time required to get an oil change at a 15-minute oil-change facility is unknown. However, records indicate that the mean time is 16.5 minutes, and the standard deviation is 4.2 minutes. Complete parts (a) through (c).
(a) To compute probabilities regarding the sample mean using the normal model, what size sample would be required?
A. Any sample size could be used.
B. The sample size needs to be greater than or equal to 30.
C. The sample size needs to be less than or equal to 30.
D. The normal model cannot be used if the shape of the distribution is unknown.
(b) What is the probability that a random sample of n = 35 oil changes results in a sample mean time less than 15 minutes?
(c) Suppose the manager agrees to pay each employee a $50 bonus if they meet a certain goal. On a typical Saturday, the oil-change facility will perform 35 oil changes between 10 A.M. and 12 P.M. Treating this as a random sample, there would be a 10% chance of the mean oil-change time being at or below what value? This will be the goal established by the manager.
Q13. The amount of time adults spend watching television is closely monitored by firms because this helps to determine advertising pricing for commercials. Complete parts (a) through (d).
(a) Do you think the variable "weekly time spent watching television" would be normally distributed? If not, what shape would you expect the variable to have?
A. The variable "weekly time spent watching television" is likely skewed left, not normally distributed.
B. The variable "weekly time spent watching television" is likely uniform, not normally distributed.
C. The variable "weekly time spent watching television" is likely normally distributed.
D. The variable "weekly time spent watching television" is likely symmetric, but not normally distributed.
E. The variable "weekly time spent watching television" is likely skewed right, not normally distributed.
(b) According to a certain survey, adults spend 2.45 hours per day watching television on a weekday. Assume that the standard deviation for "time spent watching television on a weekday" is 1.93 hours. If a random sample of 60 adults is obtained, describe the sampling distribution of x-, the mean amount of time spent watching television on a weekday.
(c) Determine the probability that a random sample of 60 adults results in a mean time watching television on a weekday of between 2 and 3 hours.
(d) One consequence of the popularity of the Internet is that it is thought to reduce television watching. Suppose that a random sample of 55 individuals who consider themselves to be avid Internet users results in a mean time of 2.11 hours watching television on a weekday. Determine the likelihood of obtaining a sample mean of 2.11 hours or less from a population whose mean is presumed to be 2.45 hours.
Interpret this probability. Select the correct choice below and fill in the answer box within your choice. (Round to the nearest integer as needed.)
A. If 1000 different random samples of size n = 55 individuals from a population whose mean is assumed to be 2.45 hours is obtained, we would expect a sample mean of 2.11 or less in about _______ of the samples.
B. If 1000 different random samples of size n = 55 individuals from a population whose mean is assumed to be 2.45 hours is obtained, we would expect a sample mean of exactly 2.11 in about _______ of the samples.
C. If 1000 different random samples of size n = 55 individuals from a population whose mean is assumed to be 2.45 hours is obtained, we would expect a sample mean of 2.11 or more in about _______ of the samples.
Based on the result obtained, do you think avid Internet users watch less television?
Q14. Describe the sampling distribution of p^. Assume the size of the population is 20,000.
n=600, p=0.7
Choose the phrase that best describes the shape of the sampling distribution of p^ below.
A. Approximately normal because n ≤ 0.05N and np(1 - p) < 10.
B. Approximately normal because n ≤ 0.05N and np(1 - p) ≥ 10.
C. Not normal because n ≤ 0.05N and np(1 - p) ≥ 10.
D. Not normal because n ≤ 0.05N and np(1 - p) < 10.
Determine the mean of the sampling distribution of p^.
Determine the standard deviation of the sampling distribution of p^.
Q15. Suppose a simple random sample of size n = 75 is obtained from a population whose size is N = 30,000 and whose population proportion with a specified characteristic is p = 0.8. Complete parts (a) through (c) below.
(a) Describe the sampling distribution of p^.
Choose the phrase that best describes the shape of the sampling distribution below.
A. Approximately normal because n ≤ 0.05N and np(1 - p) ≥ 10.
B. Not normal because n ≤ 0.05N and np(1 - p) < 10.
C. Approximately normal because n ≤ 0.05N and np(1 - p) < 10.
D. Not normal because n ≤ 0.05N and np(1 - p) ≥ 10.
Determine the mean of the sampling distribution of p^.
Determine the standard deviation of the sampling distribution of p^.
(b) What is the probability of obtaining x = 66 or more individuals with the characteristic? That is, what is P(p^≥0.88)?
(c) What is the probability of obtaining x = 57 or fewer individuals with the characteristic? That is, what is P(p^≤0.76)?