Reference no: EM13964703
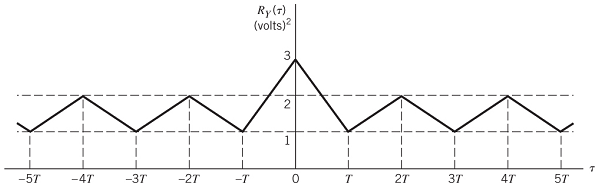
Question (1) A random process Y(t) consists of a dc component of √(3/2) volts, a periodic component g(t), and a random component X(t). The autocorrelation function of Y(t) is shown below.
(a) What is the average power of the periodic component g(t)?
(b) What is the average power of the random component X(t)?
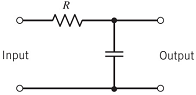
Question (2) A random telegraph signal X(t) is characterized by the autocorrelation function:
RX = exp(-2v|Τ|)
where v is a positive constant. This random signal is applied to the low-pass RC filter shown in the figure. Determine the power spectral density and autocorrelation function of the random process at the filter output.
Question (3) A white Gaussian noise process of zero mean and power spectral density N0/2 is applied to the input of high-pass RL filter shown in the figure.
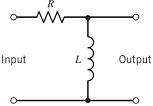
(a) Find the power spectral density and autocorrelation function of the random process ate the filter output.
(b) What are the mean and variance of this output?
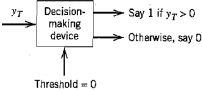
Question (4) Consider a digital communication receiver where the sample presented to the decision making device when a binary symbol "0" is transmitted can be modeled as:
YT = - A + WT
where WT is a sample of white Gaussian random process with zero mean and power spectral density N0/2. Given the decision threshold is zero as shown in the figure:
(a) Determine the mean and variance of the random variable yT.
(b) Write an expression of the probability density function (pdf) of YT, fY(YT) in terms of A and (N0/2).
(c) Show that the probability that the decision making device makes an error (i.e., decides "1" was transmitted instead of "0") can be written as:
Pe0 = Q(A/√(N0/2))
where Q(u) is the Q-function given by: Q(u) = 1/√(2Π) u∫∞ exp(-z2/2)dz
(d) The following MATLAB script simulates the detection process using 100 million observations of YT when A = 1 and (N0/2) = 0.5. It calculates the probability of error by counting the number of times an error occur (Pe) and by integrating the pdf (Peh). The pdf was estimated from the histogram of the 100 million observations.
i. Run the code and report Pe, Peh, and figure of the estimated pdf.
ii. Change (N0/2) to 0.1. Repeat (i) above. Compare your results.
iii. Change (N0/2) back to 1 and make A = 5. Repeat (i) above. Compare your results.
iv. Plot Pe versus A2/(N0/2) in the range from 1 to 100 (e.g., make A =1 and change (N0/2) from 1 down to 0.01 in steps of 0.001. You need to add a loop to the code.
v. Compare the results you obtained in (iii) to the analytical expression developed in (c) by plotting Pe and Pe0 versus A2/(N0/2) in the range from 1 to 100 on the same figure.
You need to express the Q-function given in part (c) in terms of the built-in MATLAB function erfc.
For parts (iv) and (v) use built-in MATLAB function loglog to produce the figures.
% 30/1/2016
% ELEG390 HW2 Q4: Detection of a binary symbol transmitted over AWGN channel clear all;close all;clc;
n=1e8; % Number of observations
A=1; % Pulse Amplitude N0_over_2=0.5; % Noise Variance
wT=sqrt(N0_over_2)*randn(n,1); % Gaussian noise with zero mean and variance N0/2 yT=-A+wT; % n observed samples when transmitted symbol is "0"
de=yT>0; % decision
Pe=length(find(de))/n; % Empirical Probability of error
%======================================================================================
% Estimating the Probability of error from the pdf
%=================================================
[fy1,yt] = hist(yT,1000); % Histogram of yT
fy=fy1/n; % Estimate of the pdf of yT: fy(yT) Peh=sum(fy(find(yt>0))); % Probability of error estimated from the pdf figure(1)
plot(yt,fy,'linewidth',2) ylabel 'f_y(y_T)'
xlabel 'y_T' grid on
title 'pdf of y_T'
%======================================================================================
Question (5) Using the message signal:
m(t) = 1/(1+t2)
Determine and sketch the modulated waves for the following modulation methods
(a) Amplitude Modulation with 50 percent modulation
(b) Double-sideband suppressed carrier (DSB-SC) modulation.
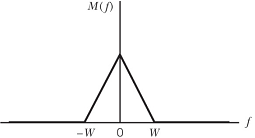
Question (6) Consider a message signal m(t) with the spectrum shown in the figure. The signal has a bandwidth of W = 1 kHz. This signal is applied to product modulator together with a carrier wave A??cos(2Πfct) producing DSB-SC modulated signal s(t). The modulated signal is applied then to a coherent detector. Assuming perfect synchronism between the carrier waves in the modulator and detector, determine the spectrum of the detector output when (a) fc = 1.25 kHz and (b) fc = 0.75 kHz. What is the lowest carrier frequency to avoid side-band overlap?
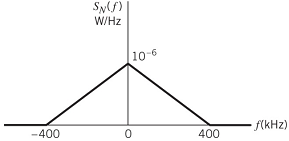
Question (7) A DSC-SC modulated signal is transmitted over a noisy channel with power spectral density shown in the figure below. The message bandwidth is 4 kHz and the carrier frequency is 200 kHz. Assuming the average power of the modulated wave is 10 Watts, determine the output SNR of the coherent receiver with bandpass filter bandwidth of 8 kHz.