Reference no: EM133323200
Homework
Instructions
All plots generated must have an xlabel, a ylabel, a legend, and a caption that interprets the plot.
Axis limits must be sensible, meaning that you may need to set the axis limits via kwargs "xlim" and "ylim" in order to make your plot more interpretable.
To create a caption, add a new cell below a plot by using the option "Insert > Insert Cell below", then change the cell into a markdown cell by using "Cell > Cell Type > Markdown". Need help making a matrix or equation in LaTex? See the Piazza resources for LaTex!
For this homework, all plots must be generated WITHOUT using the view_time_profile or view_tiled_phase_portraits MASSpy methods.
Conceptual questions
Please type your answers in the provided markdown cell below the problem. To edit a markdown cell, simply double click it.
(1) Pooling variables
(a) What is a pooled variable, and why are they used in multi-scale representation?
(b) What is a dis-equilibrium pool? Why is it physiologically important?
(c) What is a conservation pool? Why is it physiologically important?
(2) For the following reaction schema in a closed system:
where k1 = k3 >> k2. All equilibrium constants are unity.
(a) Determine the disequilibrium pools.
(b) Determine the conservation pools.
(3) Describe four characteristic signatures in dynamic phase portraits, 1- 2 sentences each.
Coding questions
All code must run from top to bottom without error. To test your notebook, use the option "Kernel > Restart and Run all"
Import packages
In [ ]: from mass import MassMetabolite, MassReaction, MassModel, Simulation, MassS
import matplotlib.pyplot as plt
from mass.visualization import plot_time_profile, plot_tiled_phase_portrait
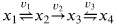
(4) Consider the following reaction scheme:

With the following parameters:
k1 = 100, k2 = 1
K1 = 1
and initial conditions:
x1,0 = 1,
x2,0 = x3,0 = 0
Steps have been put in place to assist you simulate the system. Enter your solutions in the space provided beneath each step.
Step 1: Define the stoichiometric matrix
In [ ]: raise NotImplementedError
Step 2: Define initial conditions and parameter values, then solve the system via simulation using time interval (0, 100000)
In [ ]: raise NotImplementedError
Step 3: Plot time profile and intepret results
In [ ]: raise NotImplementedError
Step 4: Define pools, plot time profile and intepret results
In [ ]:
Step 5: Plot phase portrait of pools and intepret results
In [ ]:
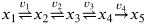
(5) Consider the following reaction scheme:
With the following parameters:
k1 = 100, k2 = 1 k3 = 0.01
K1 = K2 = 1
and initial conditions:
x1,0 = 1,
x2,0 = x3,0 = x4,0 = 0
Steps have been put in place to assist you simulate the system. Enter your solutions in the space provided beneath each step.
Step 1: Define the stoichiometric matrix
In [ ]: raise NotImplementedError
Step 2: Define initial conditions and parameter values, then solve the system via simulation using time interval (0, 100000)
In [ ]: raise NotImplementedError
Step 3: Plot time profile and intepret results
In [ ]: raise NotImplementedError
Step 4: Define pools, plot time profile and intepret results
In [ ]: raise NotImplementedError
Step 5: Plot tiled phase portraits of pools and intepret results
In [ ]: raise NotImplementedError
(6) Consider the following reaction scheme:
With the following parameters:
k1 = 100, k2 = 1 k3 = 0.01, k4 = 0.0001
K1 = K2 = K3 = 1
and initial conditions:
x1,0 = 1,
x2,0 = x3,0 = x4,0 = 0, x5,0 = 0
Steps have been put in place to assist you simulate the system. Enter your solutions in the space provided beneath each step.
Step 1: Define the stoichiometric matrix
In [ ]: raise NotImplementedError
Step 2: Define initial conditions and parameter values, then solve the system via simulation using time interval (0, 100000)
In [ ]: raise NotImplementedError
Step 3: Plot time profile and intepret results
In [ ]: raise NotImplementedError
Step 4: Define pools, plot time profile and intepret results
In [ ]: raise NotImplementedError
Step 5: Plot tiled phase portraits of pools and intepret results
In [ ]: raise NotImplementedError
(7) Generalized Pooling Matrix
Look back at the pooling matrices and reaction schemes for Problems (4), (5), and (6),
(a) Can you generalize the result to 5, 6, 7, . . . n reversible linear reactions in a series where all the equilibrium constants are unity? Fill in the following pooling matrix for n reversible linear reactions.
(b) What happens if there is an irreversible reaction replaces one of the reversible reactions?
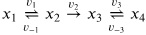
(8) Consider the reaction schema:
With the following parameters:
k1 = k3 = 1
K1 = K2 = K3 = 1
and initial conditions:
x1,0 = 1,
x2,0 = x3,0 = x4,0 = 0
(a) Simulate this system for the following three cases:
k2 = 1000
k2 = 1
k2 = 0.001
How does decreasing the value of k2 alter the dynamics of the system?
Attachment:- Jupyter Notebook.rar