Reference no: EM13880544
1. What conditions are necessary to use the chi-square goodness-of-fit test?
2. Find the expected frequency, Ei, for the given values of n and pi.
n = 140, pi = 0.6
3. A survey was conducted two years ago asking college students their top motivations for using a credit card. To determine whether this distribution has changed, you randomly select 425 college students and ask each one what the top motivation is for using a credit card. Can you conclude that there has been a change in the claimed or expected distribution? Use α = 0.10. Complete parts (s) through (d).
|
Response
|
Old
Survey %
|
New Survey Frequency, f
|
|
Rewards
|
29%
|
112
|
|
Low rates
|
23%
|
98
|
|
Cash back
|
21%
|
108
|
|
Discounts
|
7%
|
46
|
|
Other
|
20%
|
61
|
a. State H0 and Ha and identify the claim.
b. Determine the critical value, χ20, and the rejection region.
c. Calculate the test statistic.
d. Decide whether to reject or fail to reject the null hypothesis. Then interpret the decision in the context of the original claim.
4. The national distribution of fatal work injuries in a country is shown in the table to the right under National %. You believe that the distribution of fatal work injuries is different in the western part of the country and randomly select 6231 fatal work injuries occurring in that region. At α = 0.10 can you conclude that the distribution of fatal work injuries in the west is different from the national distribution? Complete parts a through d below.
|
Cause
|
National
%
|
Western Frequency
|
|
Transportation
|
44%
|
2894
|
|
Equipment
|
19%
|
1155
|
|
Assaults
|
14%
|
801
|
|
Falls
|
13%
|
753
|
|
Harmful fumes
|
8%
|
533
|
|
Fires
|
2%
|
95
|
a. State H0 and Ha and identify the claim.
b. Determine the critical value, χ20, and the rejection region.
c. Calculate the test statistic.
d. Decide whether to reject or fail to reject the null hypothesis. Then interpret the decision in the context of the original claim.
5. The frequency distribution shows the results of 200 test scores. Are the test scores normally distributed? Use α = 0.05. Complete parts (a) through (d).
|
Class boundaries
|
49.5-58.5
|
58.5-67.5
|
67.5-76.5
|
76.5-85.5
|
85.5-94.5
|
|
Frequency, f
|
19
|
60
|
84
|
33
|
4
|
Using a chi-square goodness-of-fit test, you can decide with some degree of certainty, whether a variable is normally distributed. In all chi-square test for normally, the null and alternative hypotheses are as follows.
H0: The test scores have a normal distribution.
Ha: The test scores do not have a normal distribution.
a. Find the expected frequencies.
b. Determine the critical value, χ20, and the rejection region.
c. Calculate the test statistic.
d. Decide whether to reject or fail to reject the null hypothesis. Then interpret the decision in the context of the original claim.
6. Determine whether the statement is true or false. If it is false, rewrite it as a true statement.
If the test statistic for the chi-square independence test is large, you will, in most cases, reject the null hypothesis.
7. Use the contingency table to the right to calculate the marginal frequencies and find the expected frequency for each cell in the contingency table. Assume that the variables are independent.
|
|
Athlete has
|
|
Result
|
Stretched
|
Not stretched
|
|
Injury
|
17
|
20
|
|
No injury
|
203
|
183
|
8. You want to determine whether the reason given by workers for continuing their education is related to job type. In the study, you randomly collect the data shown in the contingency table. At
α = 0.01, can you conclude that the reason and type of worker are dependent? Complete parts (a) through (d).
|
|
Reason
|
|
Type of worker
|
Professional
|
personal
|
Both
|
|
Technical
|
38
|
36
|
35
|
|
Other
|
46
|
26
|
34
|
a. Identify the claim and state the null and alternative hypotheses.
b. Determine the degree of freedom, find the critical value, and identify the rejection region.
c. Calculate the test statistic. If convenient, use the technology.
d. Decide to reject or fail to reject the null hypothesis. Can you conclude that the reason and type of worker are dependent?
9. The contingency table below shows the results of a sample of motor vehicle crash deaths by age and gender. At α = 0.025, perform a homogeneity of proportions test on the claim that the proportions of motor vehicle crash death involving males or females are the same for each group.
|
|
Age
|
|
Gender
|
16-24
|
25-34
|
35-44
|
45-54
|
55-64
|
65-74
|
75-84
|
85 and older
|
|
Male
|
96
|
73
|
68
|
69
|
32
|
29
|
25
|
7
|
|
Female
|
41
|
20
|
27
|
31
|
22
|
20
|
18
|
10
|
10. The contingency table below shows the number of adults in a nation (in million) ages 25 and over by employment status and educational attainment. Rewrite the frequencies in the table as relative frequencies by dividing each frequency by the sample size.
|
|
Educational Attainment
|
|
Status
|
Not a high school graduate
|
High school graduate
|
Some college, no degree
|
Associate's, bachelor's, or advanced degree
|
|
Employed
|
8.5
|
31.9
|
25.6
|
41.7
|
|
Unemployed
|
2.5
|
2.2
|
1.3
|
3.6
|
|
Not in the labor force
|
11.9
|
24.3
|
5.6
|
14.3
|
11. The contingency table below shows the number of adults in a nation (in million) ages 25 and over by employment status and educational attainment. The frequencies in the table can be written as relative frequencies by dividing each frequency by the sample size.
|
|
Educational Attainment
|
|
Status
|
Not a high school graduate
|
High school graduate
|
Some college, no degree
|
Associate's, bachelor's, or advanced degree
|
|
Employed
|
12.5
|
28.7
|
27.6
|
44.4
|
|
Unemployed
|
1.8
|
2.3
|
4.8
|
3.1
|
|
Not in the labor force
|
12.1
|
22.6
|
7.4
|
14.7
|
What percent of adults ages 25 and over in the nation have a degree and are unemployed?
12. List the three conditions that must be met in order to use a two-sample F-test.
13. Find the critical F-value for a right-tailed test using the indicated level of significance α and degrees of freedom d.f.N and d.f.D = 27
α = 0.05, d.f.N = 7, d.f.D = 27
14. Test the claim about the differences between two population variances σ21 and σ22 at the given level of significance α using the given sample statistics. Assume that the sample statistics are from independent samples that are randomly selected and each population has a normal distribution.
Claim: σ21 > σ22, α = 0.10
Sample statistics: s21 = 876, n1 = 6, s22 = 444, n2 = 11
15. Test the claim about the differences between two population variances σ21 and σ22 at the given level of significance α using the given sample statistics. Assume that the sample statistics are from independent samples that are randomly selected and each population has a normal distribution.
Claim: σ21 > σ22, α = 0.05
Sample statistics: s21 = 11.6, n1 = 6, s22 = 3.5, n2 = 10
16. A random sample of 31 waiting times (in minutes) before patients saw a medical professional in a hospital's minor emergency department had a standard deviation of 0.9 minute. After a new admissions procedure was implemented, a random sample of 27 waiting times had a standard deviation of 0.2 minutes. At α = 0.10, can you support the hospital's claim that the standard deviation of the waiting times has decreased? Complete parts (a) through (e)
a. Identify the claim and state H0 and Ha. Let σ21 represent the initial variance and σ22 represent the variance for the new process.
b. Determine the critical value and the rejection region.
c. Calculate the test statistic.
d. Decide whether to reject or fail to reject the null hypothesis.
e. Interpret the decision in the context of the claim. Can you support the hospital's claim?
17. To calculate the left-tailed critical F-value, do the following steps.
a. Interchange the value of d.f.N and d.f.D
b. Find the corresponding F-value.
c. Calculate the reciprocal of the F-value to obtain the left-tailed critical F-value.
Find the right- and left-tailed critical F-value for a two-tailed test with the given values.
α = 0.05, d.f.N = 5, d.f.D = 8
18. A nutritionist found that a random sample of sandwiches from two restaurants, labeled A and B, had the sample statistics shown in the table to the bottom right. Construct a 95% confidence interval for σ21/ σ21 using the definition to the right, where σ21 and σ21 are the variances of the cholesterol content of sandwiches from A and B, respectively.
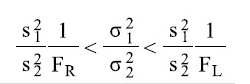
When s12 and s22 are the variances of randomly selected, independent samples from normally distributed populations, then a confidence interval for σ12/σ22 is as shown below, where FL is the left-tailed critical F-value and FR is the right-tailed critical F-value.
|
Cholesterol Content
|
|
Restaurant
|
A
|
B
|
|
Sample Variance
|
s12=10.12
|
S22=9.86
|
|
Sample Size
|
N1= 13
|
N2= 10
|
19. The table to the right shows the right shown the cost per ounce (in dollars) for a random sample of toothpastes exhibiting very good stain removal, good stain removal, and fair stain removal. At α = 0.025, can you conclude that the mean costs per ounces are different? Perform a one-way ANOVA test by completing parts a through d. Assume that each sample is drawn from a normal population, that the samples are independent of each other, and that the populations have the same variances.
|
Very good stain removal
|
Good stain removal
|
Fair stain removal
|
|
0.41
|
0.98
|
0.34
|
|
0.64
|
2.77
|
1.34
|
|
0.36
|
0.60
|
0.44
|
|
1.64
|
0.64
|
|
|
0.51
|
0.33
|
|
|
0.35
|
1.32
|
|
a. Identify the claim and state H0 and Ha.
b. Identify the degrees of freedom for the numerator and for the denominator, determine the critical value, and determine the rejection region.
c. Calculate the test statistic
d. Decide to reject or fail to reject the null hypothesis and interpret the decision in the context of the original claim.
20. In a study, a random sample of 20 adults rated the effectiveness of advertisements. Each adult rated and advertisement that lasted 30 or 60 seconds. The block design in the accompanying table shows these ratings (on a scale of 1 to 5, with 5 being extremely effective). Use α = 0.10 and a technology toll and the given block design to perform a two-way ANOVA test.
a. Determine the null and alternative hypotheses for the main effects.
b. Determine the null and alternative hypothesis for the interaction effect.
c. Determine the test statistics for the main effects.
d. Determine the test statistic for the interaction effect.
e. Determine the P-value for the main effects.
f. Determine the P-value for the interaction effect.
g. State the conclusion.
h. Interpret the results for the main effects.
i. Interpret the results for the interaction effect.
Data Table
|
|
Advertising medium
|
|
Length
|
Radio
|
Television
|
|
30 sec
|
2,1,5,2,1
|
5,3,4,5,3
|
|
60 sec
|
3,5,4,5,2
|
2,3,5,4,2
|
21. The table to the right shows the square footage (in thousands) for a random sample of buildings from four regions of a country. At α = 0.10, perform a Scheffe' test to determine which means have a significant difference.
|
Northeast
|
Midwest
|
South
|
West
|
|
26.8
|
14.2
|
13.6
|
12.6
|
|
25.6
|
15.5
|
7.6
|
3.9
|
|
21.6
|
17.1
|
10.2
|
12.1
|
|
18.9
|
12.7
|
5.1
|
11.5
|
|
16.1
|
12.3
|
12.1
|
10.1
|
|
|
|
7.6
|
21.1
|
a. Is there a significant difference in the mean square footage between the northeast and the Midwest?
b. Is there a significant difference in the mean square footage between the northeast and the south?
c. Is there a significant difference in the mean square footage between the northeast and the west?
d. Is there a significant difference in the mean square footage between the midwest and the south?
e. Is there a significant difference in the mean square footage between the midwest and the west?
f. Is there a significant difference in the mean square footage between the south and the west?