Reference no: EM13860048
PROJECT:
The main objective of this project is to do an analysis of a real life example. We must use all the skills we gotto do a good job. It's important to analyze thoroughly all the data, in order to achieve the best conclusion for making your client happy.
We've got 65 plots, and in each plot we're going to use fertilizers (variable X) to improve our production of Maize (variable Y).So we have two variables, and we are going to work with them. So the aim of this project is to decide if the use of this fertilizer is profitable and give a recommendation to the client as to how much of it should be used.
The Kg of fertilizer it cost us 26.5$, and the selling price of one tone of maize is 140$. We have to study all the results that the plots give us, to find if the fertilizer is worth it and to know how much fertilizer we should buy so that we don't waste it.
Variable X: Fertilizer (kg)
The fertilizer is the variable that will give us the answer if it's worth it or not, the investment that we will do. It will say to us the efficiency and profitability for the maize production.
Therefore we will introduce some new values in our dataset:
- The mean of fertilizer used in the 65 samples of dataset which has a value of 56.74 kg.
- The median that separates the biggest and the lowest half of our 65 samples: 53kg
- The variance, that will help us to get the Standard deviation, is 385.45
- The standard deviation, will tell us how tightly our data is clustered around the mean. 19.63
- The Interquartile range represents the 50% of the data. Removing the first and last quarters of the dataset remaining only its core will help us to get rid of the irregularities. In this case is 30=IQR
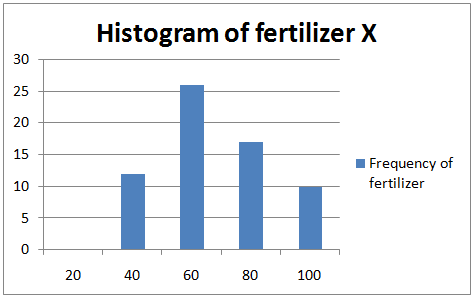
Looking our histogram, we can clearly see that our dataset remains mostly between 40-60kg of fertilizer used in every plot. Also we can see that the 2nd biggest portion of our dataset is between 60-80kg. Therefore the precision of our analysis will certainly remain in this range of data.
This is the analysis of the dataset of the variable X. Including Robust and non-Robust variables. Now we proceed to analyze the Y-value dataset.
Variable Y: Maize amount (tons)
The amount of Maize is the y-variable. We are going to use several measures to achieve the best answer such as:
- The mean is 227.22 tons of maize produced in our 65 plots.
- The median is 228, which divide the 65 samples in two halves.
Both values are very close to each other, which help us to determine that there is not a high amount of irregularities.
The IQR is 5. This interquartile range is very low.
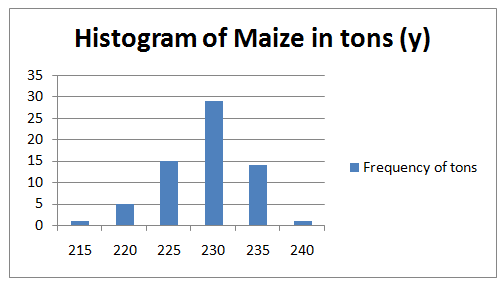
We can observe that the production is positioned between 225-230 tons, but we can see a range where is most of the production that is between 225-235 tons. Now after analyzing each variable separately, we are going to compare them.
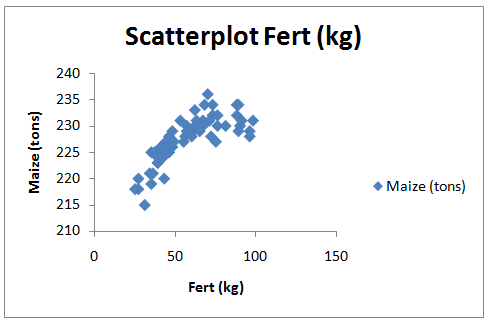
Study of Variables X and Y.
|
Developing the solar energy
: RENEWABLE ENERGY RESOURCES in general and why it start used and its developing after that choose the solar energy and make it like case study and give full technical data about.
|
|
Find general information about the organization
: Use Wikipedia to find general information about the organization. (Please keep in mind that Wikipedia is consider a secondary reference and should not be used as a resource in the scholarly work. Still, it is a very useful tool to get you starte..
|
|
Full income budget constraint on an individual
: Illustrate the full income budget constraint on an individual who has T0 units of discretionary time, Y0 units of unearned income and a wage rate of W0. In the same diagram, illustrate the utility maximizing choice of leisure and goods/income. Indica..
|
|
Explain the difference between price setter and price taker
: Explain the difference between a price setter and a price taker. Can most providers be classified strictly as price setters or price takers? What would happen financially to a healthcare organization over time if its prices were set at either full co..
|
|
Determine that there is not a high amount of irregularities
: Main objective of this project is to do an analysis of a real life example. We must use all the skills we gotto do a good job. It's important to analyze thoroughly all the data, in order to achieve the best conclusion for making your client happy.
|
|
What are some contributing demand and supply factors
: What is the cost of regular unleaded fuel in your town? What are some contributing demand and supply factors to the differences in fuel prices around the country? Think of an externality in your community. Explain what type of externality it is. How ..
|
|
How much of each good will he demand
: Edmund has the utility function U(x, y) = 2xy + 1. The prices of x and y are both $1 and Edmund has an income of $20. How much of each good will he demand? A tax is placed on x so that it now costs Edmund $2 while his income and the price of y stay t..
|
|
Compute the post-merger herfindahl
: The following, adapted from a merger case in 2014, were the approximate U.S. market shares of different cigarette companies: Altria, 47 percent; Compute the Herfindahl for this market, showing how you arrived at this number. Suppose that Reynolds Ame..
|
|
Define and isolate the full range of quality-related costs
: Which of the following is NOT a finding resulting from managers beginning to define and isolate the full range of quality-related costs
|