Reference no: EM13518905
Fault-Tolerant System Optimization by Considering Spares Allocation and Maintenance Cost
Key Questions related to topic
1. When should simulation be applied in solving asset management problems?
2. Can the Monte Carlo simulation method be applied to system optimization by considering system performance, reliability and life cycle cost?
3. How can methods of improving system reliability be studied using simulation?
4. When and how can simulation be applied to problems such as determining system life cycle cost and spares policies?
Associated Subject Learning Outcomes
The subject learning outcomes that are relevant to this assignment include:
1. Demonstrate an understanding of basic reliability theory and terminology.
2. Demonstrate an understanding of the available theory in the area of system reliability analysis.
3. Demonstrate an understanding of the principles of developing decision models.
4. Understand the uses and limitations of decision models and simulation techniques.
5. Acquire a working knowledge of basic simulation techniques and their limitations.
6. Acquire a working knowledge of the basic approach to decision modelling.
Task
You are required to set up a Monte Carlo simulation model that will allow the performance of a number of different designs for a system with hard-disc drives, HDDs, to be examined and compared. These various cases are all configured according to a particular so-called ‘fault-tolerant' architecture known as RAID architecture.
Background on Fault-tolerant systems
Summary:
Fault tolerance is effective in improving system reliability, especially for systems where maintenance cost is extremely high and stringent reliability requirement are specified. In system development, trade-off studies are always needed across system reliability, performance, and cost to ensure that the system performance is optimal with high reliability and low cost. Among the considerations are: the number of spare parts; cost of spare parts; and, cost of maintenance service in fault-tolerant system optimization. The optimization starts with reliability analysis on different fault-tolerant system architectures, followed by estimating cost including maintenance cost and spares cost. The optimization process utilizes Monte Carlo simulation. RAID 5 and RAID 6 system architectures in data storage are used to illustrate the approach.
Detailed Background:
Fault tolerance refers to the capability of a system to continue to provide an acceptable level of functionality despite the failure of some of its components. Fault tolerance techniques are widely used in large and complex systems including Multiprocessor-on-a- chip [1, 2], RAID architecture in data storage subsystems [3, 4, 5], converter systems for electrical power generation [6, 7], etc. By applying fault tolerance techniques, a higher level of system reliability and availability can be achieved. Over the past few decades, fault tolerance has been applied mainly to mechanical, electrical, electronic, and mechanical / electronic systems. In recent years, similar techniques have appeared in software systems. In particular, redundancy with or without masking capability is a common-used fault tolerance technique.
The research here focuses on a real-world industrial system called RAID utilised in the data storage industry. RAID stands for the Redundant Array of Independent (Inexpensive) Disks. RAID 5 and RAID 6 are the two most popular architectures used in the industry, in which large arrays of disks are grouped together to enhance reliability. Each group has extra "check disks" containing redundant information. When a disk fails it is replaced and the information is reconstructed using the redundant information. The corresponding time involved is referred to as time to restoration. This time can be reduced if hot standby spares are used where the replacement disk is switched automatically when a disk fails.
For RAID 5 or RAID 6 architecture, the system reliability can be estimated using either a Monte Carlo simulation or a Markov model approach. The advantage of the Monte Carlo method is that it can accept a range of component lifetime distributions including Weibull, lognormal, normal as well as exponential.
Monte Carlo Simulation of a system of hard disc drives within a RAID system architecture:
A Monte Carlo simulation method for estimation of the number of failed HDDs (hard disk drives) in RAID 5 and RAID 6 systems is described in this section. This estimation is necessary for system optimisation with considerations of spares and maintenance cost as well as system reliability. RAID 5's architecture can tolerate one failed disk while RAID 6 is able to work without data loss if the number of failed disks is less than 3.
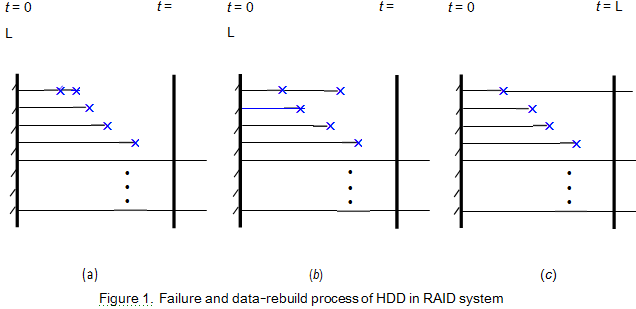
After an HDD fails, the data in the failed HDD will be built into a new HDD based on the redundant information in RAID 5 or RAID 6 architecture. A general process of HDD failure and replacement in RAID 5 and RAID 6 is illustrated in Figure 1. In a given period of time, some HDDs will fail while the rest can work without failure. As soon as an HDD in operation fails then a spare HDD on standby starts operation to take over the task after the data are rebuilt. The replacement, the new HDD that has been placed into operation will either survive or fail within a specified time. It may fail in case (a), (b), or (c) as shown in Figure 1. If it fails as in case (a), the failure time is still the shortest than the others. If it fails as in case (b), the failure time is amid other failure times. If the new HDD does not fail in the specified time, t = L, then this is the case (c) as shown in Figure 1. Here, L is the specified time which is referred to in simulation, L = 5 years, for instance.
Based on the failure and data-rebuild process of HDD in RAID, a Monte Carlo simulation program is required to be developed so that the system reliability, number of orders and number of spare parts used can be obtained, and a better policy to place new orders as well as the best system mode can be determined at system design stage. This program can be run in MS Excel, Crystal Ball, MatLab or other software environments. Descriptions of two possible structures utilising a RAID 5 architecture together with questions to be answered relating to each structure are given below.
In system development, design decisions must be made. Having trade-off data to aid decisions is helpful. The trade-off analyses need to encompass costs (including spare parts cost and cost of services) as well as system reliability. The presented method in this research is able to serve as a guideline in system module selection in design. The method should also give the cost of ownership analysis and thereby it is applicable to calculation of product warranty cost without reducing customer satisfaction.
Possible system designs to be studied
You are required to set up a Monte Carlo simulation model that will allow the performance of a number of possible designs for the architecture of a RAID 5 system to be examined and compared. One design has two different options that need to be considered. The designs you need to study are as follows:
DESIGN 1: RAID 5 without spares:
A RAID 5 system has 15 data drives (HDDs) without spares. MTTF (mean time to failure) of a HDD is 1.0 million hours. When a HDD fails, a new order is placed requiring 7 days (168 hours) on average to get a new HDD and the data rebuilt.
DESIGN 2: RAID 5 with one spare:
A RAID 5 system has 15 HDDs and 1 spare HDD which is in Cold standby when the system starts operation. It takes 3 hours in average for data to be rebuilt into a new HDD if an HDD in Cold standby is connected into the system. The MTTF of an HDD in operation is 1.0 million hours. When there is no spare HDD available and there is one failed HDD in the system, a new order is placed to order two new HDDs. It takes 7 days (168 hours) in average to get the new HDDs and data rebuilt if required.
Specific tasks for this assignment
Suppose we need to distribute 1000 RAID 5 systems, each with 15 HDDs. The 2 designs being considered, as set out previously, are to be investigated. Note that according to RAID 5 architecture, the system fails whenever there are two failed HDDs in the system.
Task 1: Develop the Monte Carlo simulation flow diagram for the problem.
Task 2: Develop and run a Monte Carlo simulation on suitable software, for example, Crystal Ball and use it to estimate the system reliability of each of the two designs.
Task 3: Calculate the life cycle costs of each of the two designs and make a comparison of the system costs based on simulation results.
Task 4: Present your approaches to deciding which design should be adopted, together with the option to be used to order new HDDs, where relevant.
Task 5: Compile a report to the Technical Development Director based on the simulation results and your analysis on the optimal system model selection. Please try to use tables and graphs to present your simulation and analysis results in your report.
Relationships and data to be assumed:
1) The times to failure of hard disk drives follow an exponential distribution and, the time to get new drives after new orders were placed plus the time used for data being rebuilt if required also follows an exponential distribution.
2) Life cycle costs can be broken down into: total initial cost just after commissioning; cost of HDDs of new orders; and, delivery cost.
3) The length of one life cycle is five years.
4) In order to make a comparison of life cycle cost, you may use the cost ratio between two system designs. One hard disk drive cost, denoted as C1, can be assumed to be constant over the product life cycle. The delivery cost should be denoted as C2.
5) A run of the simulation for 1.0 million iterations should be sufficient. Run the simulation three times and use the average of the simulated results as the final output in order to achieve acceptable accuracy. Observe and comment on the variation.