Reference no: EM131063524
In this exercise, you will solve three questions, where you will be asked to calculate a linear correlation coefficient and determine whether there is a linear correlation between the two given variables.
Solve the following problems:
- Listed below are baseball team statistics, consisting of the proportions of wins and the result of this difference: Difference (number of runs scored) - (number of runs allowed).
The statistics are from a recent year, and the teams are NY-Yankees, Toronto, Boston, Cleveland, Texas, Houston, San Francisco, and Kansas City.
|
Difference
|
163
|
55
|
-5
|
88
|
51
|
16
|
-214
|
|
Wins
|
0.599
|
0.537
|
0.531
|
0.481
|
0.494
|
0.506
|
0.383
|
o Construct a scatter plot, find the value of the linear correlation coefficient r, and find the critical values of r from Table VI, Appendix A, p. A-14, of your textbook Elementary Statistics. Use α = 0.05.
o Is there sufficient evidence to conclude that there is a linear correlation between the proportion of wins and the above difference?
- A classic application of correlation involves the association between temperature and the number of times a cricket chirps in a minute. Listed below are the numbers of chirps in 1 minute and the corresponding temperatures in °F:
|
Chirps in 1 Min
|
882
|
1188
|
1104
|
864
|
1200
|
1032
|
960
|
900
|
|
Temperature(°F)
|
69.7
|
93.3
|
84.3
|
76.3
|
88.6
|
82.6
|
71.6
|
79.6
|
o Construct a scatter plot, find the value of the linear correlation coefficient r, and find the critical values of r from Table VI, Appendix A, p. A-14, of your textbook Elementary Statistics. Use α = 0.05.
o Is there a linear correlation between the number of chirps in 1 minute and the temperature?
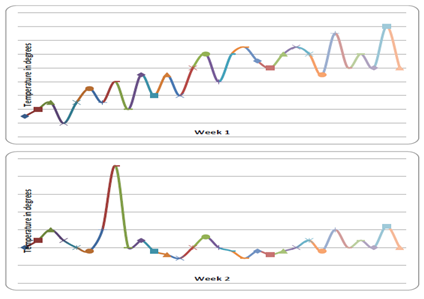
- Given below is a control chart for the temperature of a freezer unit in a restaurant. The owner of the restaurant is deciding whether or not to buy a new unit. The two charts display the temperature for the past two weeks. Write a paragraph analyzing the control charts and argue whether the owner should buy a new unit or not.
Submission Requirements:
- Submit your work in a single Microsoft Word or Excel document.
- The answer to each question should be supported with an appropriate rationale or the correct steps.
|
Write a small driver class called testemployee
: ITECH1000/5000 Programming Assignment.
|
|
The balance owed in the purchase
: Bob sells investment property in the city for $1.2 million in which he has a basis of $300,000 to Sue. Sue pays Bob $240,000 in cash and gives him a promissory note for $960,000 for the balance owed in the purchase.
|
|
Performance specifications of robotic hand that can write
: Performance specifications of robotic hand that can write
|
|
Compare samsung and apple ratios to the industry
: Compare Samsung and Apple Ratios to the industry (peer) averages and comment on how they stand when you benchmark the results?
|
|
Determine linear correlation between the two variables
: find the value of the linear correlation coefficient r, and find the critical values of r from Table VI, Appendix A, p. A-14, of your textbook Elementary Statistics. Use α = 0.05.
|
|
Funded with a million dollars at his death
: Bob had a will drafted which formed a trust for his wife that would be funded with a million dollars at his death. The trust is required to give her all income annually and allows her to designate who among their children will receive the trust pr..
|
|
Demonstrate how internetworking devices
: be able to analyse IP addressing requirements and design an addressing scheme;
|
|
Weighted average cost of capital for this firm
: The current stock price for a company is $40 per share, and there are 3 million shares outstanding. The beta for this firms stock is 1.2, the risk-free rate is 4.7, and the expected market risk premium is 5.9%. what is the Weighted Average Cost of Ca..
|
|
Information about clearwater company direct materials
: Information about Clearwater Company's direct materials cost follows: Standard price per materials gram $ 100.00 Actual quantity used 9,200 grams Standard quantity allowed for production 9,400 grams Price variance $ 77,740 F Required:
|