Reference no: EM132459349
Graded Exercise - Design of Experiments and General Linear Model
Part 1. General Problems
For any numerical calculations, download the attached file.
Assume alpha = 0.05 unless otherwise noted.
Problem 1.
A medical office wishes to better understand patient wait time. They conduct an observational study from a typical day. They track patient wait times in the waiting room and in the office waiting for the clinician (Factor 1: Process Step). They also record the doctor group that the patients visit (Factor 2: Medical Group noted as B or C) and the time of day of arrival, whether it is morning or afternoon (Factor 3: AM vs. PM). Given the following Multi-Vari Chart which of the following categorical factors appears to have the greatest effect on Average Wait Time?
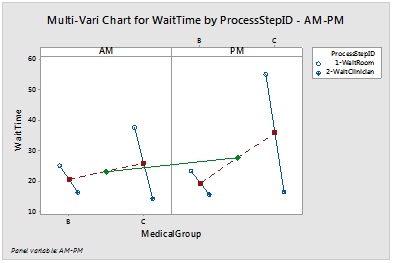
a. Time of Day (AM vs. PM) and Patient ID
b. Process Step (Wait Room vs. Clinician Office) and Medical Group (B or C)
c. Medical Group ( B or C) and Time of Day (AM vs. PM)
d. Patient ID and Arrival Time
Problem 2
Suppose you wish to study 3 factors (A, B, C) using a Full Factorial Design. Factors' A and B are at two levels; Factor C is at 3 levels. You also wish to use 3 replications per combination. Based on this information, how many samples will you have in this experiment at the ‘High Setting' for Factor C?
(Hint: Compute manually based on class formula and then confirm by creating a new experimental design using Minitab).
a. 16
b. 18
c. 12
d. 36
Problem 3
Suppose you wish to test the effect of three different methods (A, B, and C) on the output, process time. In the DOE, four different operators process an order using each of three different methods and the process time is recorded for each run (total of 12 observations). Which of the following analysis would be the most appropriate to minimize potential Type II error (i.e., beta error or fail to detect mean difference) to assess the effect of the variable method on process time?
(Note: Two Factor ANOVA may be done in Minitab using General Linear Model, GLM)
a. Two Factor ANOVA with one factor at 3 levels and one blocking variable at 4 levels (operator = blocking variable)
b. Two Factor ANOVA with process time as one factor and the method as a blocking variable
c. 2^3 Full Factorial DOE with each factor at 2 levels
d. One Way ANOVA (where Factor = Method)
Problem 4
Which of the following interaction plots shown below would you most likely conclude the following results (Factor F isNot Significant, Factor G isSignificant, and the F*G Interaction is Not Significant)?
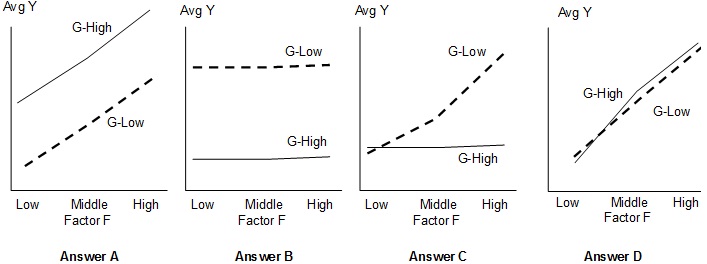
a. Graph A
b. Graph B
c. Graph C
d. Graph D
Problem 5
Suppose you conduct a two factor study to determine if there are systematic increases in average sales among three similar Products over the past year. You obtain sales data, stratified by the last four financial quarters. Next, you conduct a one-way ANOVA of sales by the factor, Product. Then, you conduct a follow-up two-factor ANOVA analysisusing General Linear Model (GLM) with both Product and Quarter as factors. Given these two analyses, which of the following may be reasonably concluded?
a. The product has a statistically significant effect on average sales using either a One-Way or Two ANOVA
b. There is a statistically significant linear relationship between product type and average sales
c. Average sales is not impacted by the financial quarter for any of these products
d. There is a statistically significant relationship between the product type and average sales after accounting for the financial quarter (i.e., by including the quarter as a blocking variable)
Part 2.DOE Catapult Simulator
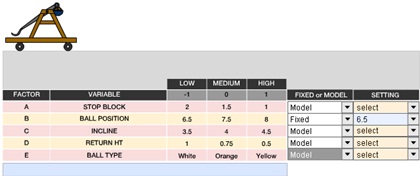
Suppose you wish to determine the appropriate settings for a catapult. You conduct an experiment to determine the effects of changing various inputs on launch distance (Y). You have 5 possible variables to adjust in your catapult at the following possible settings for each variable. Note: Low and high settings are based on their impact in terms of more or less distance.
|
Factor
|
Variable
|
Low (-1)
|
High (1)
|
|
A
|
A-Stop Block
|
2
|
1
|
|
B
|
B-Ball Position
|
|
|
|
C
|
C-Inclline
|
3.5
|
4.5
|
|
D
|
D-Return Height
|
1
|
0.5
|
|
E
|
E-Ball Type
|
White
|
Yellow
|
For your experiment, fix ball position variable setting (set ball position at 6.5) and conduct an experiment using the other 4 factors (Note: Ball position factor must be designated as "fixed" in the simulator and the other factors should be set to "Model"). Next, create a full factorial experiment in Minitab (using either 1 or 2 replications) per the settings above and then use the attached catapult simulator to obtain actual distance data (Y output) for your experiment. Then, answer the following Problems. See course website for catapult simulator.
Problem 6
Which of the following may be concluded from your DOE analysis regarding main effects?
(Factors: A-Stop Block; C-Incline; D-Return Height; E-Ball Type)
a. Factor C-Incline is the only significant main effect
b. Factors' A, C, D, and E are all significant
c. Factors' C-Incline and D-Return Ht are significant; others are not significant
d. Factors' A-StopBlock, C-Incline, and D-ReturnHt are significant but not E-Ball Type
Problem 7
Which of the following may be concluded from your DOE analysis regarding two-way interactions? (Factors: A-Stop Block; C-Incline; D-Return Height; E-Ball Type)
a. A*C is a significant interaction
b. C*D is a significant interaction
c. None of the two-way interactions are statistically significant
d. All possible two-way interactions are significant
Problem 8
Using your prediction equation from your above experiment (or the response optimizer in Minitab), which of the following combinations will get you closest to hitting a target value of 78 m (And, within +1)?
Note1: Since all students will have unique results, please choose among the answers below which yields a result closest to the objective.
Note2: Assume Factor B is fixed at 6.5.
Note3: Need to use ‘natural units' in determining your recommended settings. Or, be careful in interpreting coded values at 2 levels and converting to natural units.
(Factors: A-Stop Block; C-Incline; D-Return Height; E-Ball Type)
a. A= 1, C=3.5, D= 0.75, E= Orange
b. A= 2, C=4.5, D= 1.0, E= Yellow
c. A= Anywhere in current range, C=4.0, D= 0.5, E = White or Yellow
d. A= Anywhere in current range, C=3.5, D= 0.5, E=White or Yellow
Part 3.DOE Factorial Analysis
A marketing firm conducts an experiment to determine the impact of three factors on the number of call inquiries for an 800 number given different advertisements. The three factors and their levels are:
A-Advertisement: 1 and 2 (they are investigating two different Advertisements)
B-Time of Day: Late Morning (~10 AM or ‘10'), Late Afternoon (~4 PM or ‘16'), and Evening (~9 PM-or ‘21')
C-Position of Advertisement within program: Early in show (=0) vs. late in show (=1)
Given the attached data file, analyze using DOE General Factorial design analysis (or, you may use GLM) and then answer the following Problems.
Problem 9
For the response 'inquiries', which of the following are statistically significant?
a. Time of Day only
b. Advertisement, Time of day, and their Interaction (Adv*Time of Day) are significant but Position is not significant
c. All main effects and their two way interactions are significant
d. Position, Advertisement, Time of day, and Interaction (Adv*Time of Day) are all significant
Problem 10
Using all three X factors, which combination of ‘individual settings' below would appear to result in the highest number of call inquiries received based on these data? (Hint: Construct main effect plots and interactions plot for the significant factor combinations).
a. Advertisement 1, 9 PM (21), Late in Show
b. Advertisement 1, 9 PM (21), Early in Show
c. Advertisement 2, 9 PM (21), Early in Show
d. Run ads at ~9 PM time slot using any setting for other factors
Attachment:- Design of Experiments and General Linear Model.rar