Design of a realistic pulse shape

Assignment Help Simulation in MATLAB
Reference no: EM131976130

Project - Please use Matlab to complete.

Project Goal: This project examines the design of a realistic pulse shape to be used with linear modulation that will meet a spectral emissions mask.

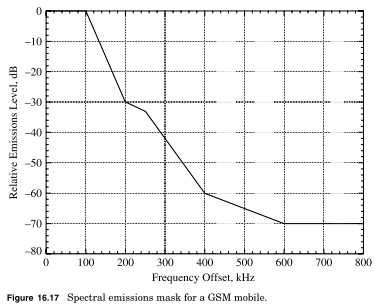
A spectral emissions mask is given in Figure 16.17. This spectral emissions mask is the one used for GSM handsets. So this problem is one of great practical interest.

2020_figure.png

Consider a linear stream modulation having the form

Xz(t) = √(Eb)k=1K_b Dz(k)u(t-(k-1)T)

The design is further constrained in that the pulse, u(t), must not extend for longer than Tu = 40 us in time. Design a pulse shape that will satisfy Nyquist's criterion for an arbitrary constellation.

For the remainder of the project it is assumed that the pulse shape designed above is used with BPSK modulation. Any finite length pulse shape which achieves this spectral mask will have to produced some intersymbol interference (1S1) (i.e., Nyquist's criterion cannot exactly be met). Hence the matched filter demodulator given in Figure 16.18 will not be exactly optimal but can be made to be very close to optimal with a well designed pulse shape.

513_figure1.png

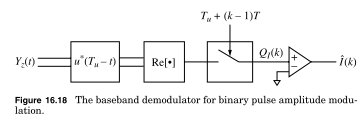
(a) Assume Dz(k) = 1, compute the worse case degradation for an arbitrary pulse shape to the bit error probability for the demodulator given in Figure 16.18. Specifically consider the case of the kth bit where k = Kb/2 where Kb is large and compute the effects of ISI. Identify the values of Dz(j), j ≠ k which achieve this worse case degradation for an arbitrary pulse shape with BPSK modulation.

(b) Design a pulse shape and corresponding symbol rate such that the worse case (over all ISI patterns) degradation to the effective Stilt is less than 0.26 dB and the spectral mask given in Figure 16.17 is met by the transmission. Grades will be assigned proportional to the achieved symbol rate (higher the better!). Anyone who beats the posted solution will get a bonus of 10 points for the project!

(c) Plot the transmitted complex envelope for the pulse shape that was designed in (b). Plot the real component of the matched filter output for a modulation sequence of (1- 111 - 11 - 1 - 1- 11) for your design. Identify the symbol time sampling points.

Reference no: EM131976130

Questions Cloud

What is the crossover rate for projects : What is the crossover rate for Projects A and B? 26.93 percent 25.20 percent 25.91 percent 26.67 percent
What was the impact of advice : Describe any constructive advice you have received from anybody who has coached you. What was the impact of this advice?
Effective interpersonal skills : With all the emphasis on online job hunting, how do you demonstrate that you have effective interpersonal skills?
Determine the deposit to the nearest dollar : In five years a company will purchase equipment costing $100,000. The company decides to place a single deposit into a savings account.
Design of a realistic pulse shape : Project Goal: This project examines the design of a realistic pulse shape to be used with linear modulation that will meet a spectral emissions mask
Two friends consider opening driving range for golfers : Two friends consider opening a driving range for golfers.The project is expected to be evaluated over a 6 year life.
Prevent unintentional death : Identify the role of patient safety and the influence on the Federal initiatives that are used to prevent unintentional death as a result of medical mistakes.
What are three benefits of consuming alcohol : What are three benefits of consuming alcohol? Aside from abstaining from alcohol entirely, how can potential risks associated with drinking alcohol be avoided?
What is the after-tax cost of preferred stock for fjord : Fjord Luxury Liners has preferred shares outstanding that pay an annual dividend equal to $13 per year. If the current price of Fjord preferred shares.

Reviews

Write a Review

Simulation in MATLAB Questions & Answers

  Calculate the stress intensity factor

Use the three-parameter zone finite element method or the boundary collocation method to calculate the stress intensity factor K, at the crack tip for the plate

  Build a simulation using newtons laws of motion

Build a new and different simulation of your own using Newtons laws of motion and Show the code and describe how it works

  Write the specification of load mover

Write the specification of LOAD MOVER detailed of the whole design and precise for automatic control section and divide the design into various modules and Is the kernel required if yes which one?

  Design the automatic control section using statecharts

Aim of this project is to design an embedded system which can move loads from one place to another. The system can be operated manually, automatically and wirelessly.

  Need an expert who can model a drill in simulink

Need an expert who can model a drill in Simulink. Working model of a drill needing for an improvment to behave more realistically as a drill to drill through plastic block.

  Project is on load frequency control using fpid

Project is on load frequency control using FPID tuned using GA and PSO algorithm and the system is a two area system.

  Number of packets received with time

Let x be the number of packets received with time -

  Build a matlab based graphical user interface

Build a Matlab based graphical user interface (GUI) that operates in conjunction with a base Matlab/ Simulink simulation program. Any base simulation is considered acceptable.

  Build a matlab based graphical user interface

Build a Matlab based graphical user interface (GUI) that operates in conjunction with a base Matlab/ Simulink simulation program. Any base simulation is considered acceptable.

  Simulate the standardised sum of independent

Simulate the standardised sum of independent and identically distributed variates - Fit a linear regression model as in Q5, and plot your estimates for β0 and β1 as N increases, together with a line indicating their true values. Supply your code.

  Plot the original periodic square wave

Plot the original periodic square wave on the same graph. Comment on the difference between the original periodic square wave and its truncated Fourier series presentation.

  Use matlab to plot the function

Plot the original periodic square wave on the same graph. Comment on the difference between the original periodic square wave and its truncated Fourier series presentation.

Free Assignment Quote

Assured A++ Grade

Get guaranteed satisfaction & time on delivery in every assignment order you paid with us! We ensure premium quality solution document along with free turntin report!

All rights reserved! Copyrights ©2019-2020 ExpertsMind IT Educational Pvt Ltd