Reference no: EM131324420
Problem 1 [10pts.]: The CSU-CHILL radar made observations of the Ponnequin Wind Farm located on the boarder of Wyoming and Colorado near I-25. The wind farm is approximately 62 km away from the radar. Complex valued digital signals observed by the radar from a rotating wind turbine are provided. The data is sampled with a period of 1.042 milliseconds.
Compute the time dependent Fourier transform of the complex digital signal. Plot it as a 2- dimensional function of true analog frequency (Hz) on the y-axis and time (sec) on the x-axis between 0 to 10 sec.
Interpret the results. Think about the interpretation of a frequency shift in a radar signal? In MATLAB, the following code will open the file containing CSU-CHILL radar time-series data and extract the time-series as variable “x” to be used.
%Load the data
load('CHILL20100218_174815_01_rg435.mat')
%Select the receiver voltage time-series for 10000 samples
x = double(pulse.H(1:10000));
Problem 2 [20pts.]: The CSU-CHILL radar transmits a pulse of power and receives power from returned echoes. The radar data file contains data from CSU-CHILL observations. Both horizontal and vertical echo power data are provided. Assume the observations were taken with the sampling interval of 1 millisecond per pulse. In total 512 pulses were stored at 10 range samples. Please note that all samples are complex numbers. There is a matrix of 10x512 complex numbers.
Compute the Spectra of the complex digital signal for the 3 rd range sample (vector of 512 numbers). Plot the Spectra with the true analog frequency on the x-axis (Hz). Interpret the results. Think about the interpretation of a frequency shift in a radar signal?
In MATLAB, the following code will open the file containing CSU-CHILL radar time-series data and extract the time-series as variable “x” to be used. MATLAB code for reading the radar data file:
load('exam_ts.mat'); %Load the data
x = h_ts_data; %Select the horizontal echo complex ts data
Note that after reading the data file (‘exam_ts.mat’) all the other required information/data will be automatically loaded on the MATLAB workspace.
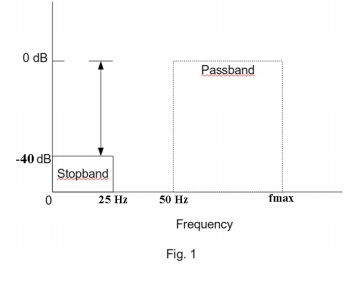
Problem 3 [20pts.]: Design a high pass filter (See Fig. 1) to obtain 40dB suppression. These types of filters are used to suppress ground clutter in Doppler radars. Design a filter with either Kaiser Window or Min-Max design (your choice). Show the filter response and demonstrate it meets the specifications. Also plot the filter coefficients (use MATLAB)
This filer is also called the ground clutter filter. Apply this filter to the digital radar signal given in problem 2 to produce the output and plot the spectra and the Time Dependent Fourier Transform. Interpret the results.
|
Describe the protocols and foundations of the internet
: Analyze the functional problems of throughput, delay, and packet loss as it pertains to your plan. Analyze and explain how you would use.DNS in your plan. Compose a two-paragraph executive summary highlighting the main points of your plan. Use at l..
|
|
How their true cost of living changes over time
: Under what circumstances would people find this index to be as useful as or more useful than the Consumer Price Index in measuring how their true cost of living changes over time?
|
|
Connection between textbook biology and biology
: The biology concepts presented in this course are taught in a way that encourages you to make the connection between textbook biology and biology that appears in newspapers and periodicals. This assignment will encourage you to make the connection..
|
|
Discuss two international events involving the us military
: Discuss two (2) international events involving the US military from the past five (5) years that can be traced back to a foreign policy created after the Civil War
|
|
Design and computations - digital signal processing
: Compute the time dependent Fourier transform of the complex digital signal. Plot it as a 2- dimensional function of true analog frequency (Hz) on the y-axis and time (sec) on the x-axis between 0 to 10 sec.
|
|
What is the time to maturity of the option
: Suppose you are considering a European call option with a strike price of $110. What is the time to maturity of this option where the boundary condition begins to be non-zero?
|
|
What is the beta of this stock
: The common stock of Jensen Shipping has an expected return of 9.96 percent. The return on the market is 8 percent and the risk-free rate of return is 4.5. What is the beta of this stock?
|
|
What is the return on each stock
: The following three stocks are available in the market: Stock A 11.2 % 1.34 Stock B 14.4 1.14 Stock C 16.9 1.54 Market 14.8 1.00 Assume the market model is valid. The return on the market is 15.6 percent and there are no unsystematic surprises in the..
|
|
What is the annually compounded risk free interest rate
: A non-dividend-paying common stock is trading at $100.- What is the annually compounded risk-free interest rate where the boundary condition begins to be non-zero?
|