Reference no: EM133094643
Control Systems And Automation
Assessment - Basic Principles And Control Actions
Question 1. Choose a simple single control loop used on a process you are familiar with (it could be domestic or industrial).
(a) Explain why the control is necessary.
(b) Write a description of the control system.
(c) Produce an algorithm of the control system.
(d) Draw a block diagram of the control system.
(e) State the type(s) of signal used in the process.
(f) State whether the control is open or closed loop, feed forward or feedback.
(g) State and describe the sensor used for measuring the process variable to be controlled.
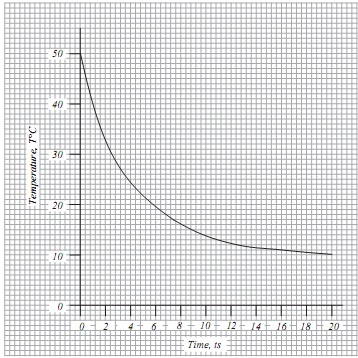
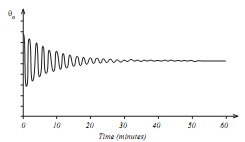
Question 2. The curve in FIGURE 1 shows the response of a bare thermocouple which has been subjected to a step change in temperature from 50°C to 10°C. Assuming that the bare thermocouple behaves as a single transfer lag system, determine the mathematical relationship between the temperature (T) and time (t) [i.e. determine the equation relating T to t].
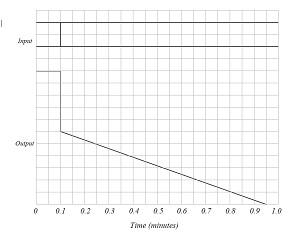
Question 3. FIGURE 3 shows an open loop system containing a distance velocity lag and a single transfer lag.
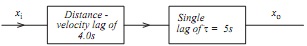
FIG. 3
If the system input xi is subjected to a step disturbance from 2 units to 12 units, plot the response of xo on a base of time. Determine graphically, and verify mathematically, the time taken for the output to change by 4 units.
Question 4. FIGURE 5 shows an electrically heated oven and its associated control circuitry. The current, I, to the oven's heating element is fed from a voltage-controlled power amplifier such that I = εK1. A voltage, VD, derived from a potentiometer, sets the desired oven temperature, TD. The oven temperature is measured using a thermocouple that, for simplicity, is assumed to generate a constant emf of 10 μV per degree Celsius. The effect of the ambient temperature is ignored.
(a) Represent the arrangement by a conventional control-system block diagram. Identify the following elements in the block diagram: input; error detector (comparator); controller; controlled element; detecting element and feedback loop.
(b) Derive an expression for the transfer function of the system, in terms of the system parameters k1, k2, kO and kt.
(c) Using the data given in TABLE A, calculate the oven temperature when the potentiometer is at its mid-point.
|
PARAMETER
|
VALUE
|
|
kt
|
10 μV/°C
|
|
kO
|
6.9 °C/A
|
|
k1
|
6 A/V
|
|
k2
|
2400
|
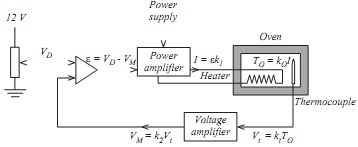
Question 5. The proportional control system of FIGURE 3(a) has an input, θ1, of 10 units. The uncontrolled input, θ2, has a value of 50 units, prior to a step change down to 40 units. The result of this disturbance upon the output, θ0, is shown in FIGURE 3(b).
(a) Calculate the change in offset in the output produced by the step change.
(b) Draw a modified block diagram to show how the offset could be minimised by the inclusion of another control action. Also, show by means of a sketch how the modification might be expected to affect the output response.
(c) Show, by drawing a modified block diagram, how the magnitude of the disturbance could be minimised by the inclusion of a third type of control action.
Question 6. (a) FIGURE 5 shows the input and output waveforms for a proportional plus integral controller. State:
(i) the controller's proportional gain
(ii) the controller's integral action time
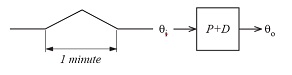
(b) FIGURE 6 shows a proportional plus derivative controller that has a proportional band of 20% and a derivative action time of 0.1 minutes. Construct the shape of the output waveform for the triangular input waveform shown, if the input rises and falls at the rate of 4 units per minute.
Assessment 2 - Modelling Of Processes And Control Devices And Systems
Question 1. A steady state distillation process is shown diagrammatically as FIGURE 1.
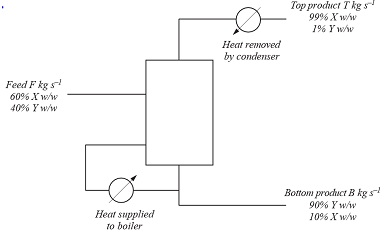
Assuming no heat losses to the atmosphere:
(i) Write four balanced equations for this system.
(ii) Identify where any. constitutive equations may be required for the modelling processes
Question 2. A process can be represented by the first order equation
4dy(t)/dt + y(t) = 3u(t)
Assume the initial state is steady (y = 0 at t = -0).
(a) Determine the transfer function of this process in the s domain.
(b) If the input is a ramp change in u(t) = 4t, determine the value of y(t) when t = 10 s.
Question 3. Using a simulator of your own choice, or the one used during the lessons at the website;
note the initial values used by the simulator and the output produced. For BOTH ON-OFF and PID control,
(a) sketch (or print copies) of the effect of changing the following parameters from their existing value (resetting them to the original after every change has been recorded):
(i) Increasing the proportional control by a factor of 10.
(ii) Decreasing proportional control by a factor of 10.
(iii) Increasing the integral control by a factor of 10.
(iv) Decreasing integral control by a factor of 10.
(v) Increasing the derivative control by a factor of 10.
(vi) Decreasing derivative control by a factor of 10.
(vii) Increasing the hysteresis by a factor of 10.
(viii) Decreasing hysteresis by a factor of 10.
(ix) Increasing the system lag by a factor of 10.
(x) Decreasing system lag by a factor of 10.
(b) Explain your results.
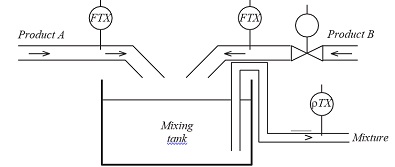
Question 4. The purpose of the arrangement shown in FIGURE 4 is to mix the two liquid products A and B in a fixed mass ratio. Product A, which is itself a mixture, is a 'wild' flow, whilst product B, a pure compound, is controlled. As the mixture leaves the tank the transmitter ?TX measures its density.
(a) Complete the diagram to show how the arrangement could be controlled by the method of 'variable ratio control'.
(b) Identify which transmitter provides 'feedforward'.
(c) Describe how the control system responds to a disturbance caused by a variation in the density of product A.
Question 5. FIGURE 5 shows a partially completed diagram of a flow control system. The flow controller is reverse acting and has a 0.2 to 1.0 bar pneumatic output signal which will supply both control valves V1 and V2.
The small range control valve, V2, only needs to operate on the first 25% output change of the controller output signal. For larger flow rates the small range valve will remain fully open and control will be achieved by operation of the large range valve. Note the differing air failure action of the two valves.
Design a system utilising valve positioners which will meet the prestated specifications.
Attachment:- Control Systems And Automation.rar