Reference no: EM132766665
BUS 201 Microeconomics - Emirates College of Technology
LO 1: Describe the production possibilities frontier and relate its importance to utilizing firms' economic resources efficiently.
LO 2: Construct the supply and demand curves and interpret them to understand market forces.
LO 3: Employ the costs, output concepts and revenue curves and their relationships in order to maximize the economic profits of firms.
LO 4: Use the characteristics of market structures to formulate market economic activities of the firm.
Question 1:
Based on the figure below, answer the following questions:
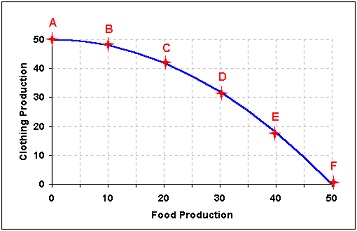
a. What this figure represents. Explain.
b. How does the above curve illustrate the tradeoff we must make to increase food production?
Question 2:
In Italian restaurant, Jack needs 1 hour and a half to prepare pizza and 1 hour to make lasagna. Pascal needs 2 hours to make a pizza and 1 hour and a half to make a lasagna.
1. Which one has the comparative advantage in preparing pizza, in preparing lasagna. Explain your answer.
2. Which one has the absolute advantage in preparing lasagna, in preparing Pizza. Explain your answer.
Question 3:
1.Choose one company (preferably local) and analyze the main economic activity of the company.
2. Identify the type of market structure the company falls into stating reasons explaining such classification.
3.Discuss the advantages and the disadvantages of the market structure and translate them as strengths and opportunities for the company.
Question 4:
|
Price
|
Quantity demanded
|
Quantity supplied
|
|
3
|
150
|
60
|
|
4
|
100
|
100
|
|
5
|
70
|
130
|
|
6
|
50
|
150
|
1. Plot the demand and supply curve in the same graph
2. What is the market equilibrium
3. If the price of chocolate is $3 describe the situation in the market and explain how the price adjusts.
4. If the price of chocolate is $5, describe the situation in the market and explain how the price adjust.
5. Chocolate sellers know that Valentine's Day is next weekend, and they expect the price to be higher, so they withhold 60 chocolates from the market this weekend. What will be the price this weekend?
Question 5:
a) Fill in the empty cells in the table.
You have been also given following additional info-
Price = $ 10 Wage = $ 1500
|
Labor (L)
|
Output (q)
|
Marginal Product of Labor
|
Value of the marginal product of labor:
|
Wage
|
Marginal profit
|
|
0
|
0
|
|
|
|
|
|
1
|
400
|
|
|
|
|
|
2
|
720
|
|
|
|
|
|
3
|
960
|
|
|
|
|
|
4
|
1020
|
|
|
|
|
b) When the company should stop hiring Workers. Explain
Q6. Problem Solving
1. Dream Line manufacturing has a fixed scale of plant with the levels of total product given in the table below for different levels of labor. Complete the table by calculating the average product and marginal product.
|
Quantity of labor
(workers)
|
Total product
|
Average product
|
Marginal product
|
|
0
|
0
|
|
|
|
1
|
29
|
|
|
|
2
|
54
|
|
|
|
3
|
77
|
|
|
|
4
|
95
|
|
|
2. Tony's Pizza Company has some missing cost data and needs your help to provide the missing data in the following table in spaces identified as A, B, C, D, E, F, G& H.
You have been also given following additional info-
• All costs are in $
• Total fixed cost of company is $ 60