Reference no: EM13906314
1. Describe the measures of central tendency. Under what condition(s) should each one be used?
2. Last year, 12 employees from a computer company retired. Their ages at retirement are listed below. First, create a stem plot for the data. Next, find the mean retirement age. Round to the nearest year.
55 77 64 77 69 63 62 64 85 64 56 59
3. A retail store manager kept track of the number of car magazines sold each week over a 10-week period. The results are shown below.
27 30 21 62 28 18 23 22 26 28
a. Find the mean, median, and mode of newspapers sold over the 10-week period.
b. Which measure(s) of central tendency best represent the data?
c. Name any outliers.
4. Joe wants to pass his statistics class with at least a 75%. His prior four test scores are 74%, 68%, 84% and 79%. What is the minimum score he needs on the final exam to pass the class with a 75% average?
5. Nancy participated in a summer reading program. The number of books read by the 23 participants are as follows:
10 9 6 2 5 3 9 1 6 3 10 4 7 6 3 5 6 2 6 5 3 7 2
|
Number of books read
|
Frequency
|
|
1-2
|
|
|
3-4
|
|
|
5-6
|
|
|
7-8
|
|
|
9-10
|
|
a. Complete the frequency table.
b. Find the mean of the raw data.
c. Find the median of the raw data.
6. The chart below represents the number of inches of snow for a seven-day period.
|
Sunday
|
Monday
|
Tuesday
|
Wednesday
|
Thursday
|
Friday
|
Saturday
|
|
2
|
5
|
3
|
10
|
0
|
4
|
2
|
a. Find the mean, median, and mode.
b. Which is the best measure of central tendency?
c. Remove Wednesday from the calculations. How does that impact the three measures of central tendency?
d. Describe the effect outliers have on the measures of central tendency.
7. A dealership sold 15 cars last month. The purchase price of the cars, rounded to the nearest thousand, is represented in the table.
|
Purchase price
|
Number of cars sold
|
|
$15,000
|
3
|
|
$20,000
|
4
|
|
$23,000
|
5
|
|
$25,000
|
2
|
|
$45,000
|
1
|
a. Find the mean and median of the data.
b. Which measure best represents the data? Use the results to support your answer.
c. What is the outlier and how does it affect the data?
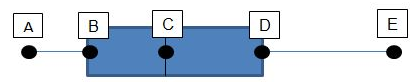
8. What do the letters represent on the box plot?
9. The test scores from a math final exam are as follows:
64 85 93 55 87 90 73 81 86 79
a. Create a box plot using the data.
b. Label the five points on the box plot and include numerical answers from part "a."
10. Using the data and results from Question 9, answer the following questions.
a. What is the median?
b. What is the range?
c. What is the interquartile range?
d. In a short paragraph, describe the data in the box plot.
|
What amount of deduction for bad debt expense
: What amount of deduction for bad debt expense can William claim this year if he uses the accrual method? What amount of deduction for bad debt expense can William claim this year if he uses the cash method?
|
|
Representing indigent, incarcerated people
: Do you think Stevenson had any idea that representing indigent, incarcerated people was going to be his life's work? How did he take care of himself while doing difficult and exhausting work? What did he struggle with and what kept him from quitting ..
|
|
The machine will generate annual cash flows
: A company is considering investing in a new machine that requires a cash payment of $ 47,946 today.
|
|
The possibilities and hopes
: After all that has just passed, all the lives taken, and all the possibilities and hopes that died with them, it is natural to wonder if America's future is one of fear. Some speak of an age of terror. I know there are struggles ahead, and dangers to..
|
|
Describe the measures of central tendency
: Describe the measures of central tendency. Under what condition(s) should each one be used
|
|
What amount of deductions does adam recognize in year zero
: Adam elects the accrual method of accounting for his business. What amount of deductions does Adam recognize in year 0 for the following transactions?
|
|
The farm labor to get more profit in food
: Most of the farm laborers are paid under the minimum wage. And they are working more hours than normal people. According to the video that we watched in the class, the market of the food and farm labor are controlled by the supermarket like Safeway a..
|
|
Which it currently manufactures and sells
: Kando Company incurs a $ 9 per unit cost for Product A, which it currently manufactures and sells for $ 13.50 per unit.
|
|
How much can travis deduct in year one from the activities
: Assuming Travis is an accrual-method taxpayer, how much can he deduct in year 1 from these activities? Assuming Travis is a cash-method taxpayer, how much can he deduct in year 1 from these activities?
|