Reference no: EM133092213
Modelling and Analysing Quadratic Equations
Related Concept Equivalence, Patterns, Models
Global Context Scientific and technical innovation
Exploration: Processes and solutions
SQL Representing patterns through equivalent forms of models helps determine the appropriate process that leads to solutions.
Goal: Your goal is to create a cost-efficient smart phone that will maximize your company's profit
Standards:
CCSS.MATH.CONTENT.H5ASSE.E.3
Choose and produce an equivalent form of an expression to reveal and explain properties of the quantity represented by the expression.
C CSS.MATEL CO NTEN T.HSA. SSE.B.3-41
Factor any quadratic expression to reveal the zeros of the function defined by the expression.
C CSS,MATH.0 0 NTENT.H5A.55E.B.3.B
Complete the square in a quadratic expression to reveal the maximum or minimum value of the function defined by the expression.
CCSS.MATECONTENT.US.A.2ELBA
Solve quadratic equations in one variable.
C CS& MATH,C 0 NTENT.H SA. RE I,B.4.A
Use the method of completing the square to transform any quadratic equation in x into an equation of the form (x - p)2 - q that has the same solutions. Derive the quadratic formula from ax2 + bx + c - O.
CCSS.M A TH.CONTENT.H5A.RFIA 43
Solve quadratic equations by inspection (e.g., for x2 = 49), taking square roots, factoring, completing the square, and the quadratic formula, as appropriate to the initial form of the equation (limit to real number solutions).
C CSS.MATEL C 0 NTENT.HSF,IF,B.5
Relate the domain of a function to its graph and, where applicable, to the quantitative relationship it describes. For example, if the function h(n) gives the number of person-hours it takes to assemble n engines in a factory, then the positive integers would be an appropriate domain for the function.
CCSS.M A TH.1.0 NTF.NT.H
Graph linear and quadratic functions and show intercepts, maxima, and minima (as determined by the function or by context).
C CSS.MATH .00 NTENT.HSF.W.C.8
Write a function defined by an expression in different but equivalent forms to reveal and explain different properties of the function,
CCSS.MATH.CONTENT,H5F,IF,C,B,A
Use the process of factoring and completing the square in a quadratic function to show zeros, extreme values, and symmetry of the graph, and interpret these in terms of a context. For example, compare and contrast quadratic functions in standard, vertex, and intercept forms.
CCSS.MATH.CONTENT.HSF.1F.C.9
Compare properties of two functions each represented in a different way (algebraically, graphically, numerically in tables, or by verbal descriptions). For example, given a graph of one function and an algebraic expression for another, say which has the larger maximum,
Part I:
Question 1: You will compare profit functions for different companies from selling smart phones.
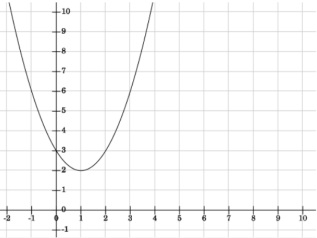
X-axis = Number of Smart Phones sold (in millions) = g (for galaxy phone) y-axis = Profit (in millions of dollars) = P(g)

The line above shows the profit from selling tablets for the Samsung Galaxy Phone la. Label the line as ''Samsung", the x-axis and the y-axis.
b. Describe the key features of the graph, Key features include concavity, x and y-intercepts and the vertex.
c. Is the vertex a max. or min. point? Describe what the vertex means in terms of this problem.
d. Create an equation in completed the square form. Then translate this to standard form. Completed the square form -> f(x) =
Standard form 4 f(x) =
Question 2: Apple is also analyzing their profit of the iPhones they sell.
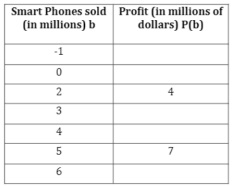
Apple: Profit from iPhones Sold
A. Based on the table, create an equation in factored form (hint look for the x-intercepts of the function). Then translate the factored form into completed the square form and standard form.
Factored form P(i) =
Standard form 4 1)(i) =
Completed the square form 4 P(i) =
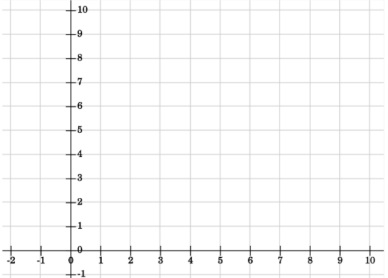
B. Sketch a graph of the function P(i) using information from the three forms of the equation you made in part b. Be sure to label the x and y axis.

Question 3: Blackberry is also in the business of selling phones. The data for the profit that Blackberry makes on selling tablets is represented by the following equation with profit being P(b) and b being number of blackberry phones sold (both variables in millions):
P(b) = -x2 + 8x - 8
a. Use the quadratic formula to solve the equation. What do these points tell us about the graph?
b. Complete the following table. Based on the table, estimate the vertex for the function. Is the vertex a max. or a min. point?

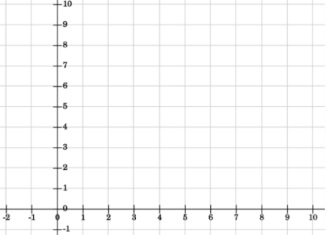
c. Sketch a graph for Blackberry. Label the x and y axis (for b and P(b))

d. Tell me how you sketched the graph (what information did you use?)
Part II: Report on Tablet Profit
In complete sentences and 1-2 complete paragraphs please write a report on the three companies selling phones. In the report please include the following:
a. What is the same about the three data sets/lines? Notes/Ideas:
b. What is different about the three data sets/lines? Notes/Ideas:
c. Describe the long-term trend for each company. In other words, for each company, write at least one sentence that describes if each company will make money as they sell more phones, lose money or come out even.
Notes/Ideas:
d. Recommend one company to invest in based on the graph - what company would you want to be a part of and why?
Notes/Ideas:
e. Reflection - write at least one sentence describing how you felt about this assignment -which representation (graph, table or equation) is easiest for you to work with and why.
Write down one task or problem from this assignment that you think you need more review/work on.
Now to start the writing assignment,
It is highly recommended that you jot down notes for each part and then complete an Idea Organizer to help organize and clarify your thoughts.
Attachment:- Modelling and Analysing Quadratic Equations.rar