Reference no: EM132400498
Assignment
Instructions.
Please make sure if you use R you copy and paste it into Word using Courier Font (makes it easier to Read). For each of the problems that are looking for a response (not just a calculation), be sure to explain and interpret the results. If you aren't sure...ASK PLEASE. Please start each question on a new page and clearly label that start of each problem (Maybe slightly larger font, bold face , underline... ) anything that will help me find the problem you are working on.
1. Given the following Matrices
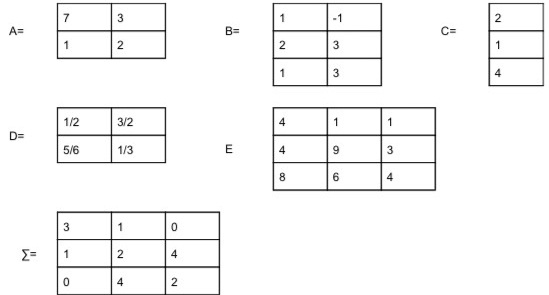
Calculate the following: DO NOT USE R for these problems except for 10
1) AB
2) A'D'B'
3) Find the determinant of D. Show all work
4) (AA)A'
5) Find the trace of matrix E
6) Using Matrix E , is (X1 +X2, X3) independent (show work)
7) Using Matrix E , is (1/3 X1 + X2 +1/3 X3, X1) independent (show work)
8) Assume Sigma (Σ) is the covariance matrix of a matrix X. Calculate the V1/2
9) Calculate the correlation matrix of Sigma (Σ) (do not use the cov2cor function)
10) Using R calculate the determinant of matrix E
2. Using the dataset provided (Question 2.csv) answer the following:
a) Describe the distribution of each of the columns independently. Conduct a qqplot for each column. You may add any additional plots you like
b) For all columns conduct a statistical test of normality. Does this match with your graphical assessment
c) Conduct a multivariate normal test for Columns 1---3 and columns 4&5, independently.
d) Based on this what can you conclude about the multivariate normality of the entire dataset.
You may conduct a full test across all columns, but please answer the question based on your results in part c.
3. Using the dataset in "bank.csv".
a) Conduct a correlation analysis among the variables provided, pay close attention to the whether or not a variable might be related to the final column 'y', which determines whether a client will open up a bank account.
b) Interpret the results in a, and provide an explanation of whether this is a good method to predict whether someone might open an account
c) What is the odds ratio of single people to married people in the dataset?
d) Is there another better method that could be used to determine if someone will open an account? If so execute the method and interpret your findings. However, provide an interpretation to the most relevant variables, i.e. give the executive two or three things that will make the most impact.
4) You've been asked to conduct an analysis of wine for a company. Using the wine dataset ('wine.csv'), The company has a variable for the quality of the wine, which is what the company would like to know. They want to know what attributes lead to higher quality. Using the dataset conduct an analysis:
Note: Use 80% of the data to train your model and test your result against the final 20%.
a) What issues might be present using the dataset given?
b) Using the wine dataset create a model to predict the quality of the wine based on all the variables. Design your model and identify significant variables.
c) Asses your models as needed to arrive at a final model and discuss how you arrived at the final model. Discuss all statistically significant variables and the validity of your model
d) Using the AIC/BIC and PRESS criterion determine which model you believe to the best.
e) Based on your final model, chart the residuals versus fitted and describe it and whether it is good or bad.
5. Using the dataset "peas.csv".
A researcher believes that there is a correlation between the taste, color and structure of the peas, but isnt really sure. Remember taste and color as a whole aren't directly observed, they are implied from variables.
a) Conduct the appropriate correlation tests for all variables. What conclusions can you begin to draw.
b) Conduct an analysis that will help assess the correlation between taste and color
c) Conduct a separate analysis that exams the taste and structure.
d) Interpret your findings and provide all necessary charts.
6) Using the data from dataset birds.txt for a sample of birds taken last year, if the average tail and wing length are given for the past have centuries:
Years [1900-1950]: μ = [170, 240]
Years [1950-2000]: μ = [190, 280]
a) provide the S and S-1 matrices, is there a correlation between the X1,and X2 variables, how can you tell?
b) Which part of the century is the sample most like, if any? What tests would you conduct as a researcher based on the information above, and how do you interpret your findings?
c) Determine the length and directions of the 95% confidence region
d) Sketch the confidence interval for tail and wing length on a graph.
e) Sketch (using Powerpoint,Word or R), the two dimensional confidence ellipsoid based on the axis. You do not need to use R, although you can if you want. This is a test of your understanding of what the confidence ellipsoid looks like.
7) Using the experiment.txt file determine the following
a) Conduct a boxplot for Dry weight, Optical density, and Product yield for temperature, N-source interpret the plots
b) Conduct an ANOVA analysis, and provide a hypothesis for temperature and N-source separately for Dry weight Optical density Product yield. Are there any main effects?
c) See if there are any interaction effects if you include the other group variables.
d) Is there a difference in the mean Dry weight, Optical density Product yield for all different groups (temperature, N-source, experiment) simultaneously.
8. Theoretical Questions (Please no more than a paragraph on each of these)
a) Is visualization a useful tool, why /why not? What are some of the problems with visualization?
b) If a dependent variable in a regression is not continuous, can you provide a method for prediction. If so how can the coefficient of independent variables be interpreted.
c) Two Variables might be correlated, however what would you caution an analyst about correlated variables, be clear and complete.
d) After examining a set of data you find that there are a few data points which seem abnormal. How would you identify if they are abnormal? How would this potentially affect your results and what course of action would you take.
e) Provide an explanation of how the p-value should be interpreted and used. If you conduct an analysis, how would you explain a p-value of .049 to an executive.
Attachment:- Data File.rar