Reference no: EM133150506
Project Report
Part A
Objective:
The purpose of this project is to provide you with an opportunity to demonstrate an advanced level of synthesis, understanding and communication of the concepts, statistical methods and practical analyses within R that you have learnt throughout this course.
Please remember that STA8005 is a postgraduate level course which requires that students demonstrate an advanced level of knowledge, skills, reasoning and problem- solving. Also, this project is a significant assessment item worth 40% of your final grade. As such you should expect to find it challenging and expect to spend considerable time working on it. I encourage you to start as soon as possible. You do not need to have completed all of the course work and topics to make a start on becoming familiar with the data.
The Data:
A consultancy firm has asked you to explore some data about vehicles and address three specific aspects of interest (Tasks 1, 2 and 3 below) for their client, and then report your process and findings in a written report.
The data file vehicles.txt contains data for 12 variables from 400 vehicles. The variables relate to the size, fuel efficiency and price of the vehicles. Each of the 12 variables are defined below. Before beginning the Tasks, you may need to do some data cleaning due to missing data or outliers. All analysis for the following tasks should be based on your cleaned data set. For the purpose of this exercise assume that the data meets any required MVN assumptions.
Definition of 12 variables in vehicles.txt:
• Name: The vehicle make and model name
• retail: Suggested Retail Price, what the manufacturer thinks the vehicle is worth, including adequate profit for the automaker and the dealer (U.S. Dollars)
• cost: Dealer Cost (or "invoice price"), what the dealership pays the manufacturer (U.S. Dollars)
• engine_size: Engine Size (litres)
• cylinders: Number of Cylinders (4, 6 or 8)
• horsepower: Horsepower (ft-lb/s) (foot-pounds per second)
• city_mpg: City Miles Per Gallon
• highway_mpg: Highway Miles Per Gallon
• weight: Weight (Pounds)
• wheel_base: Wheel Base (inches)
• length: Length (inches)
• width: Width (inches)
Task 1: The client would like to know the number of vehicles in the sample after cleaning. They would also like to know the number of vehicles with 4, 6 or 8 cylinders recorded in the data and the mean and standard deviation of the retail price of each cylinder group.
Action: Clean the data as necessary and describe the changes you have made and the final structure of the data you will analyse. Provide a frequency table of the number of vehicles by cylinder group and describe. Find the mean and standard deviation by cylinder group. Interpret interesting aspects of this data summary.
They would also like to know what the relationships are between the engine_size based on the variables: retail, cylinders, horsepower, city_mpg and highway_mpg. Which engine sizes are most similar to each other and which are most different?
Action: First, create a new variable called engine_gr and recode the engine size variable so that:
Engine size <2 = engine_gr 1
Engine size >=2 & <3 = engine_gr 2
Engine size >=3 & <4 = engine_gr 3
Engine size >=4 & <5 = engine_gr 4
Engine size >=5 engine_gr 5
Provide a table showing the number of vehicles in each engine_gr level and comment. Perform, provide relevant output, and interpret a cluster analysis to show the multivariate relationships among engine sizes (engine_gr). Note: there are several ways you could perform the cluster analysis - be sure to explain what you tried and explain why you decided on your final choice. (25 marks)
Task 2: For 6-cylinder cars only determine if there is a linear relationship between two sets of variables:
• Car size variables: weight, length, wheelbase and width
• Fuel efficiency: horsepower, city_mpg and highway_mpg
Action: Subset the data as needed and briefly describe this new set of data. Select the best method (from those covered in this course only) to explore this Task.
Perform the analysis, provide relevant output, and interpret.
Task 3: Can cylinder number be predicted using the car size and fuel efficiency variables mentioned in Task 2?
Action: Select the best method (from those covered in this course only) to explore this question, perform the analysis, provide relevant output, and interpret.
In order to successfully classify cases into groups or categories there does need to be some differences between those groups. We have covered a test in this course that specifically tests for differences between groups. For those cases in your test set, are there significant differences among the cylinder groups based on the using the car size and fuel efficiency variables mentioned in Task 2?
Action: Select the best method (from those covered in this course only) to explore this question, perform the analysis and interpret. Provide a summary table of results. Include in your answer appropriate p-values for all significance tests performed. How do your results here relate to your results in the first Action of Task 3?
Part B
Question 1:
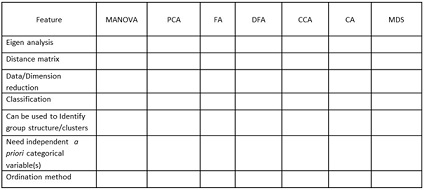
Recreate and complete the table below by indicating which features are relevant to each method.
Question 2:
Construct by hand a simple nearest-neighbour dendrogram from the distance matrix below. (Note: it is acceptable to draw by hand and insert a photo of your dendrogram)
1 2 3 4
2 1.912370
3 5.382450 7.120542
4 3.385996 5.059430 2.138709
5 1.512238 3.190303 4.575420 2.910661
Question 3:
What are the limitations or disadvantages of multivariate methods generally? (no more than 300 words)
Question 4:
Describe when a Mantel's randomisation test might be used and how the significance of the test statistic is calculated.
Question 5:
Explain your understanding of eigenvectors and eigenvalues (your answer must be in your own words and will be checked using a plagiarism checker) (no more than 300 words).
Attachment:- project report.rar