Reference no: EM133023120 , Length: word count:1100
QUAL110002 Statistical Quality Control
Question 1
An engineer selects 10 parts that represent the expected range of the process variation. Three operators Vera, Philip and Chris measure the 10 parts, three times per part, in a random order.
The engineer performs a crossed Gage R&R study to assess the variability in measurements that may be from the measurement system. Table 1. Gage R&R Study Data shows the Measurement System Analysis (MSA) data. MSA data is also saved in the ‘Excel Worksheet GR&R' available in myUWS. Enter the MSA data into a MINITAB worksheet. The value of the Study Variation is 5.15. For the Process Tolerance, the value of Upper spec-Lower spec is 8.
1.1
1.1.1- Analyse GR&R data in MINITAB for a crossed study and choose "Xbar and R" for the method of analysis.
1.1.2- Export Minitab output by sending it to Microsoft Word.
1.1.3- Discuss the results in the context of your method of analysis i.e. "Xbar and R".
1.2
1.2.1- Analyse GR&R data in MINITAB for a crossed study and choose "ANOVA" for the method of analysis.
1.2.2- Export Minitab output by sending it to Microsoft Word.
1.2.3- Discuss the results in the context of your method of analysis i.e. "ANOVA".
1.3
1.3.1- Compare "Xbar and R" and "ANOVA" methods for this particular data set. Which method would be more appropriate?
1.3.2- The engineer performs a ‘CROSSED GAGE' R&R study. Is a ‘crossed gage' study appropriate for this case?
|
RunOrder
|
Parts
|
Operators
|
Measurement
|
|
RunOrder
|
Parts
|
Operators
|
Measuremen
|
|
1
|
1
|
Chris
|
0.29
|
|
|
52
|
2
|
Vera
|
-1.13
|
|
2
|
2
|
Chris
|
-0.56
|
|
|
53
|
3
|
Vera
|
1.09
|
|
3
|
3
|
Chris
|
1.34
|
|
|
54
|
4
|
Vera
|
0.20
|
|
4
|
4
|
Chris
|
0.47
|
|
|
55
|
5
|
Vera
|
-1.07
|
|
5
|
5
|
Chris
|
-0.80
|
|
|
56
|
6
|
Vera
|
-0.67
|
|
6
|
6
|
Chris
|
0.02
|
|
|
57
|
7
|
Vera
|
0.01
|
|
7
|
7
|
Chris
|
0.59
|
|
|
58
|
8
|
Vera
|
-0.56
|
|
8
|
8
|
Chris
|
-0.31
|
|
|
59
|
9
|
Vera
|
1.45
|
|
9
|
9
|
Chris
|
2.26
|
|
|
60
|
10
|
Vera
|
-1.77
|
|
10
|
10
|
Chris
|
-1.36
|
|
|
61
|
1
|
Chris
|
0.64
|
|
11
|
1
|
Philip
|
0.08
|
|
|
62
|
2
|
Chris
|
-0.58
|
|
12
|
2
|
Philip
|
-0.47
|
|
|
63
|
3
|
Chris
|
1.27
|
|
13
|
3
|
Philip
|
1.19
|
|
|
64
|
4
|
Chris
|
0.64
|
|
14
|
4
|
Philip
|
0.01
|
|
|
65
|
5
|
Chris
|
-0.84
|
|
15
|
5
|
Philip
|
-0.56
|
|
|
66
|
6
|
Chris
|
-0.21
|
|
16
|
6
|
Philip
|
-0.20
|
|
|
67
|
7
|
Chris
|
0.66
|
|
17
|
7
|
Philip
|
0.47
|
|
|
68
|
8
|
Chris
|
-0.17
|
|
18
|
8
|
Philip
|
-0.63
|
|
|
69
|
9
|
Chris
|
2.01
|
|
19
|
9
|
Philip
|
1.80
|
|
|
70
|
10
|
Chris
|
-1.31
|
|
20
|
10
|
Philip
|
-1.68
|
|
|
71
|
1
|
Philip
|
0.07
|
|
21
|
1
|
Vera
|
0.04
|
|
|
72
|
2
|
Philip
|
-0.68
|
|
22
|
2
|
Vera
|
-1.38
|
|
|
73
|
3
|
Philip
|
1.34
|
|
23
|
3
|
Vera
|
0.88
|
|
|
74
|
4
|
Philip
|
0.20
|
|
24
|
4
|
Vera
|
0.14
|
|
|
75
|
5
|
Philip
|
-1.28
|
|
25
|
5
|
Vera
|
-1.46
|
|
|
76
|
6
|
Philip
|
0.06
|
|
26
|
6
|
Vera
|
-0.29
|
|
|
77
|
7
|
Philip
|
0.83
|
|
27
|
7
|
Vera
|
0.02
|
|
|
78
|
8
|
Philip
|
-0.34
|
|
28
|
8
|
Vera
|
-0.46
|
|
|
79
|
9
|
Philip
|
2.19
|
|
29
|
9
|
Vera
|
1.77
|
|
|
80
|
10
|
Philip
|
-1.50
|
|
30
|
10
|
Vera
|
-1.49
|
|
|
81
|
1
|
Vera
|
-0.15
|
|
31
|
1
|
Chris
|
0.41
|
|
|
82
|
2
|
Vera
|
-0.96
|
|
32
|
2
|
Chris
|
-0.68
|
|
|
83
|
3
|
Vera
|
0.67
|
|
33
|
3
|
Chris
|
1.17
|
|
|
84
|
4
|
Vera
|
0.11
|
|
34
|
4
|
Chris
|
0.50
|
|
|
85
|
5
|
Vera
|
-1.45
|
|
35
|
5
|
Chris
|
-0.92
|
|
|
86
|
6
|
Vera
|
-0.49
|
|
36
|
6
|
Chris
|
-0.11
|
|
|
87
|
7
|
Vera
|
0.21
|
|
37
|
7
|
Chris
|
0.75
|
|
|
88
|
8
|
Vera
|
-0.49
|
|
38
|
8
|
Chris
|
-0.20
|
|
|
89
|
9
|
Vera
|
1.87
|
|
39
|
9
|
Chris
|
1.99
|
|
|
90
|
10
|
Vera
|
-2.16
|
|
40
|
10
|
Chris
|
-1.25
|
|
|
|
|
|
|
|
41
|
1
|
Philip
|
0.25
|
|
|
|
|
|
|
|
42
|
2
|
Philip
|
-1.22
|
|
|
|
|
|
|
|
43
|
3
|
Philip
|
0.94
|
|
|
|
|
|
|
|
44
|
4
|
Philip
|
1.03
|
|
|
|
|
|
|
|
45
|
5
|
Philip
|
-1.20
|
|
|
|
|
|
|
|
46
|
6
|
Philip
|
0.22
|
|
|
|
|
|
|
|
47
|
7
|
Philip
|
0.55
|
|
|
|
|
|
|
|
48
|
8
|
Philip
|
0.08
|
|
|
|
|
|
|
|
49
|
9
|
Philip
|
2.12
|
|
|
|
|
|
|
|
50
|
10
|
Philip
|
-1.62
|
|
|
|
|
|
|
|
51
|
1
|
Vera
|
-0.11
|
|
|
|
|
|
|
Table 1. Gage R&R study Data
Question 2
The Scottish National Blood Transfusion Service (SNBTS) is the specialist provider of transfusion medicine in Scotland, supplying high quality blood, tissues and cells services. They tested 13 samples of donated blood to determine the presence of RH factor.
Table 2. Blood Test Data shows the results of the test. The results are also saved in the ‘Excel Worksheet Blood Test' available in myUWS.
2.1
2.1.1- Enter the data into a MINITAB worksheet and apply the appropriate control chart.
2.1.2- Export Minitab output by sending it to Microsoft Word.
2.2
2.2.1- Critically discuss the results.
2.2.2- Comment on the assumptions you made.
|
Date
|
Number of Defectives
(D i)
|
Sample Size (n i)
|
|
2-Nov
|
12
|
116
|
|
3-Nov
|
14
|
126
|
|
4-Nov
|
18
|
112
|
|
5-Nov
|
13
|
134
|
|
6-Nov
|
17
|
121
|
|
7-Nov
|
15
|
119
|
|
8-Nov
|
15
|
138
|
|
9-Nov
|
16
|
109
|
|
10-Nov
|
11
|
111
|
|
11-Nov
|
14
|
125
|
|
12-Nov
|
13
|
129
|
|
13-Nov
|
14
|
144
|
|
14-Nov
|
17
|
141
|
Table 2. Blood Test Data
Question 3
Paisley Alba Ltd manufactures various parts for MRI machines. One part, a transmitter plate, resembles a flat round plate with four keyways stamped into it. The dimension being measured is the inside diameter which has a tolerance of 7.125 ± 0.010.
3.1
Based on a quality control procedure, an operator has measured four parts every hour. These values have been entered in ‘Excel Worksheet Paisley Alba Ltd' available in myUWS.
Using the data provided in ‘Excel Worksheet Paisley Alba Ltd', construct a proper chart manually or by applying Excel or Minitab to check whether the process is in statistical control.
3.2
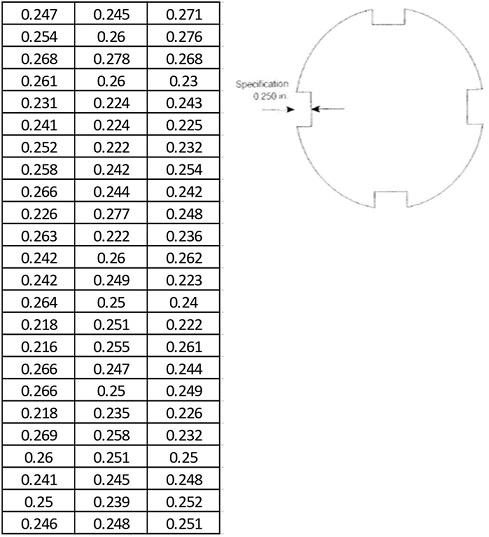
Recently, the customer brought to the manufacturer's attention the fact that not all of the keyways are being cut out to the correct depth. The manufacturer asked the quality technician to measure each keyway in five parts every 15 minutes and record the measurements. Figure 1 shows the transmitter plate and ungrouped data.
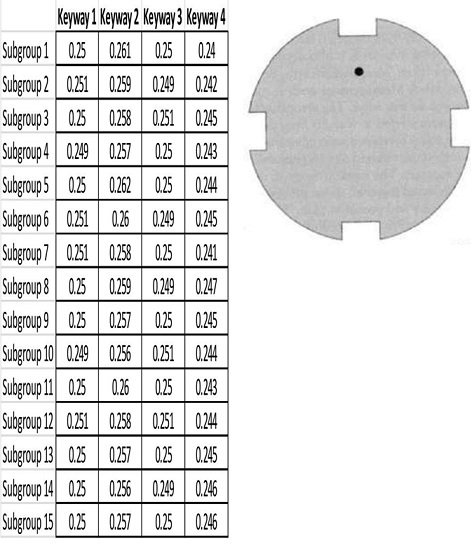
In a second experiment, during the stamping process, Paisley Alba Ltd placed a small mark below one of the keyways. The mark labels that keyway as number
1. Clockwise around the part, the other keyways are designated 2, 3, 4. The mark does not affect the use of the part. The technician was asked to measure the keyway depths again, five parts every 15 minutes. Figure 2 shows the transmitter plate with a mark and grouped data.
You are to answer the following questions. You are NOT specifically told every calculation you must perform, and you have complete autonomy on breadth and depth. The lectured materials should be utilised. In industry, you would collect data then perform the required analysis yourself, unaided by instruction.
3.2.1- Use the sets of data to conduct a Six Sigma DMAIC.
3.2.2- Include any assumptions you make.
3.2.3- Identify five major challenges a quality engineer faces in events such as this one.

Figure 1. Transmitter Plate and ungrouped data (in inches)

Figure 2. Transmitter Plate with a mark and grouped data (in inches)
Question 4
Demonstrate a critical understanding of the following statistical tools and their criteria for selection. Make comments about their limitations and assumptions to deploy.
4.1-Design of Experiments (DoE)
4.2-Process Capability
4.3-The Central Limit Theorem
4.4-Regression analysis
Attachment:- Statistical Quality Control.rar