Reference no: EM13847569
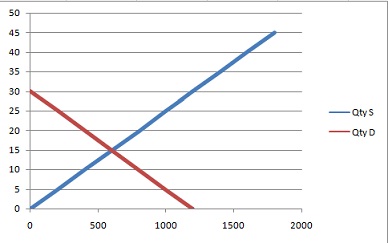
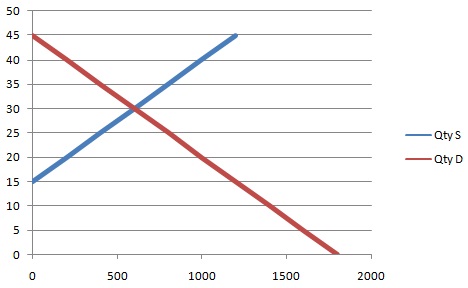
Problem: Table Illustrates the supply and demand schedules for calculators in Sweden and Norway. On graph paper, draw the supply and demand schedules for each country.
|
Supply and Demand Schedules for Calculators
|
|
|
Sweden
|
|
|
Norway
|
|
|
Price
|
Qty S
|
Qty D
|
Price
|
Qty S
|
Qty D
|
|
0
|
0
|
1200
|
0
|
|
1800
|
|
5
|
200
|
1000
|
5
|
|
1600
|
|
10
|
400
|
800
|
10
|
|
1400
|
|
15
|
600
|
600
|
15
|
0
|
1200
|
|
20
|
800
|
400
|
20
|
200
|
1000
|
|
25
|
1000
|
200
|
25
|
400
|
800
|
|
30
|
1200
|
0
|
30
|
600
|
600
|
|
35
|
1400
|
|
35
|
800
|
400
|
|
40
|
1600
|
|
40
|
1000
|
200
|
|
45
|
1800
|
|
45
|
1200
|
0
|
Sweden:
Norway:
a) In the absence of trade, what are the equilibrium price and quantity of calculators produced in Sweden and Norway? Which country has the comparative advantage in calculators?
Sweden's equilibrium price is $15 and their equilibrium quantity is 600.
Norway's equilibrium price is $30 and their equilibrium quantity is 600.
Sweden has the comparative advantage due to it's lower price.
b) Assume there are no transportation costs. With trade, what price brings about balance in exports and imports? How many calculators are traded at this price? How many calculators are produced and consumed in each country with trade?
c) Suppose the cost of transporting each calculator from Sweden to Norway is $5. With trade, what is the impact of the transportation cost on the price of calculators in Sweden and Norway? How many calculators will each country produce, consume, and trade?