Reference no: EM131132199
Question 1:
a) Create a bar graph or line graph for the following data including labels:
Presto Printing Company sales for one week, beginning February 2:
$9,300
$7,900
$5,409
$5,876
$5,420
$3,769
$8,900
b) Create a circle graph with the following data including labels:
Food expenses $400
Gasoline $150
Child's Tuition $50
Rent $750
Medicine $50
Car Payment $350
Auto Insurance $100
Health care $150
Total $2,000
Question 2: The following graph represents the percentage of each fruit I prefer.
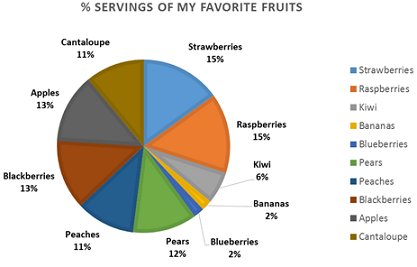
If I eat 1,800 pieces of fruit per year, based on my serving preference, how many of each types of fruit will I consume next year? Show all calculations.
Question 3: When choosing what kind of graph to use, there are three basic choices; line graphs, bar graphs, and pie charts. Search the internet for a situation where choosing the right type of graph to represent the information is important.
Explain in a well-constructed essay why you chose that situation, what kind of graph is best for it, and why. Discuss what kinds of data are better portrayed by another kind of graph.
Be sure to cite your source
Your essay should be complete and cover each point as outlined above. Be sure to include at least one text citation.
|
How are decision trees utilized in healthcare management
: How are decision trees utilized in healthcare management? Discuss the three key parts of any decision and provide at least one specific example of how decision trees relate to healthcare management decisions. Your response should be at least 200 word..
|
|
Relationship between salesperson and customer
: Describe the typical relationship between salesperson and customer looking for life insurance . Describe the appropriate salesperson’s attitudeand appearance. Describe the methods used to strengthen a long-term relationship for repeats and referrals ..
|
|
How would you measure the value of work at home in gdp
: Calculate measured employment and unemployment and the measured labor force for each economy. Calculate the measured unemployment rate and participation rate for each economy. In which economy is measured GDP higher?
|
|
What is strategic outsourcing
: What is strategic outsourcing? Describe why a company would explore this as an alternative to vertical integration, as well as any potential advantages.
|
|
Define what kinds of data better portrayed by kind graph
: When choosing what kind of graph to use, there are three basic choices; line graphs, bar graphs, and pie charts. Search the internet for a situation where choosing the right type of graph to represent the information is important. Explain in a we..
|
|
Company leverage horizontal integration as strategy
: Why would a company leverage horizontal integration as a strategy? What are the advantages and disadvantages? Why would a company leverage vertical integration as a strategy? What are the advantages and disadvantages?
|
|
Distinguish between cyberwar and cyberterror
: Distinguish between the two types of reconnaissance probes used by computer hackers. Distinguish between cyberwar and cyberterror. Differentiate among the various types of cybercrime like fraud, theft, and extortion.
|
|
Orders based on the on hand quantity in stock
: A Manager was heard to complain, “I have some items that have a two week review interval, and it takes four weeks for resupply. Every two week, I place orders based on the on hand quantity in stock. Now I seem to have too much inventory.” What went w..
|
|
What type of identity choice michael has
: what type of identity choice Michael has? - confusion - foreclosure - moratorium - achievement
|