Reference no: EM131303556
Designing an Electricity System
1. Define the notion of a load duration curve. Explain how the shape of the load duration curve for a particular system affects the selection of technology mix.
2. Explain the key features of each of the following. Indicate which types of generation technologies are typically used in each case.
a. baseload generation
b. intermediate load following power plants
c. peaking power plants.
3. For each type of generation technology, what are typical levelized unit energy costs (LUECs) at the present? You will need to search the web to obtain recent figures. (For example, see the
U.S. Energy Information Administration website.)
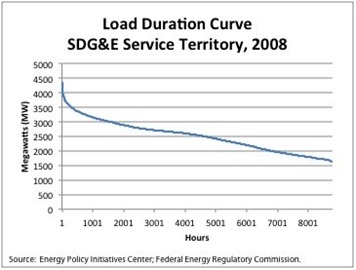
4. Consider the load duration curve for San Diego Gas and Electric displayed below.

a. Approximately what proportion of the year does demand exceed 3000 megawatts?
b. How many megawatts of baseload is in this system, if base-load runs at least 80% of the time?
c. How many megawatts of intermediate capacity is required if this type of generation runs at least 40% and no more than 80% of the time?
d. How many megawatts of peaking capacity is required?
5. Based on the results in question 4, design an electricity system by selecting appropriate magnitudes of baseload, intermediate and peaking generation. You must select specific technologies in each case. What is the average cost of electricity in your system?
6. Ontario electricity demand data are available on the IESO Website. Download the *.csv file entitled Hourly Ontario Market Demand at https://www.ieso.ca/Pages/Power-Data/Data- Directory.aspx. Once you have done so, extract demand data for each of the years 2007 to 2014. Using these data, plot the sequence of Load Duration Curves on a single graph. Has the curve shifted over time? Are there years when it is unusually low or unusually high? Why do you think this has been the case?
Attachment:- HourlyDemands 2002-2015.rar
|
Performance management communication at accounting
: After evaluating Accounting, Inc.'s communication plan, does it answer all the questions that a communication plan should answer?- Which questions are left unanswered?
|
|
Corporate governance and impact on financial decision making
: Think about corporate governance and its impact on financial decision making. We've seen how important certain factors and estimates, such as the cost of capital, forecasts of interest rate changes, etc., can be to the reliability of project valuatio..
|
|
Evaluating two different cookie-baking ovens
: You are evaluating two different cookie-baking ovens. The Pillsbury 707 costs $73, 000, has a 5-year life, and has an annual OCF (after tax) of -$11, 900 per year. The Keebler CookieMunster costs $99, 500, has a 7-year life, and has an annual OCF (af..
|
|
Name three phenomena that might shift the demand curve
: Suppose the following graph shows what prevailed on the foreign exchange market in 2010 with floating exchange rates.
|
|
Define the notion of a load duration curve
: ECO 314: Energy and the Environment - Define the notion of a load duration curve. Explain how the shape of the load duration curve for a particular system affects the selection of technology mix.
|
|
What is the companys net income
: The Moore Corporation has operating income (EBIT) of $550,000. The company's depreciation expense is $110,000. Moore is 100% equity financed, and it faces a 35% tax rate. What is the company's net income? $ Assuming no changes to any of the Balance S..
|
|
Find the after-tax rates of return on all three securities
: The Shrieves Corporation has $5,000 that it plans to invest in marketable securities. It is choosing among AT&T bonds, which yield 9.25%, state of Florida muni bonds, which yield 5.5% (but are not taxable), and AT&T preferred stock, with a dividend y..
|
|
Compare and contrast project management approaches
: Compare and contrast project management approaches and their appropriateness for managing a variety of project types.
|
|
What explanations can you give for the change
: Check the Internet or any daily newspaper to see what the "price" of a euro is today. What explanations can you give for the change? Make sure you check what has happened to interest rates and economic growth.
|