Reference no: EM13848562
Marshall Report 1 Econ 135 Fall 2015
You will need only the data in the comparison.xlsx to complete this report.
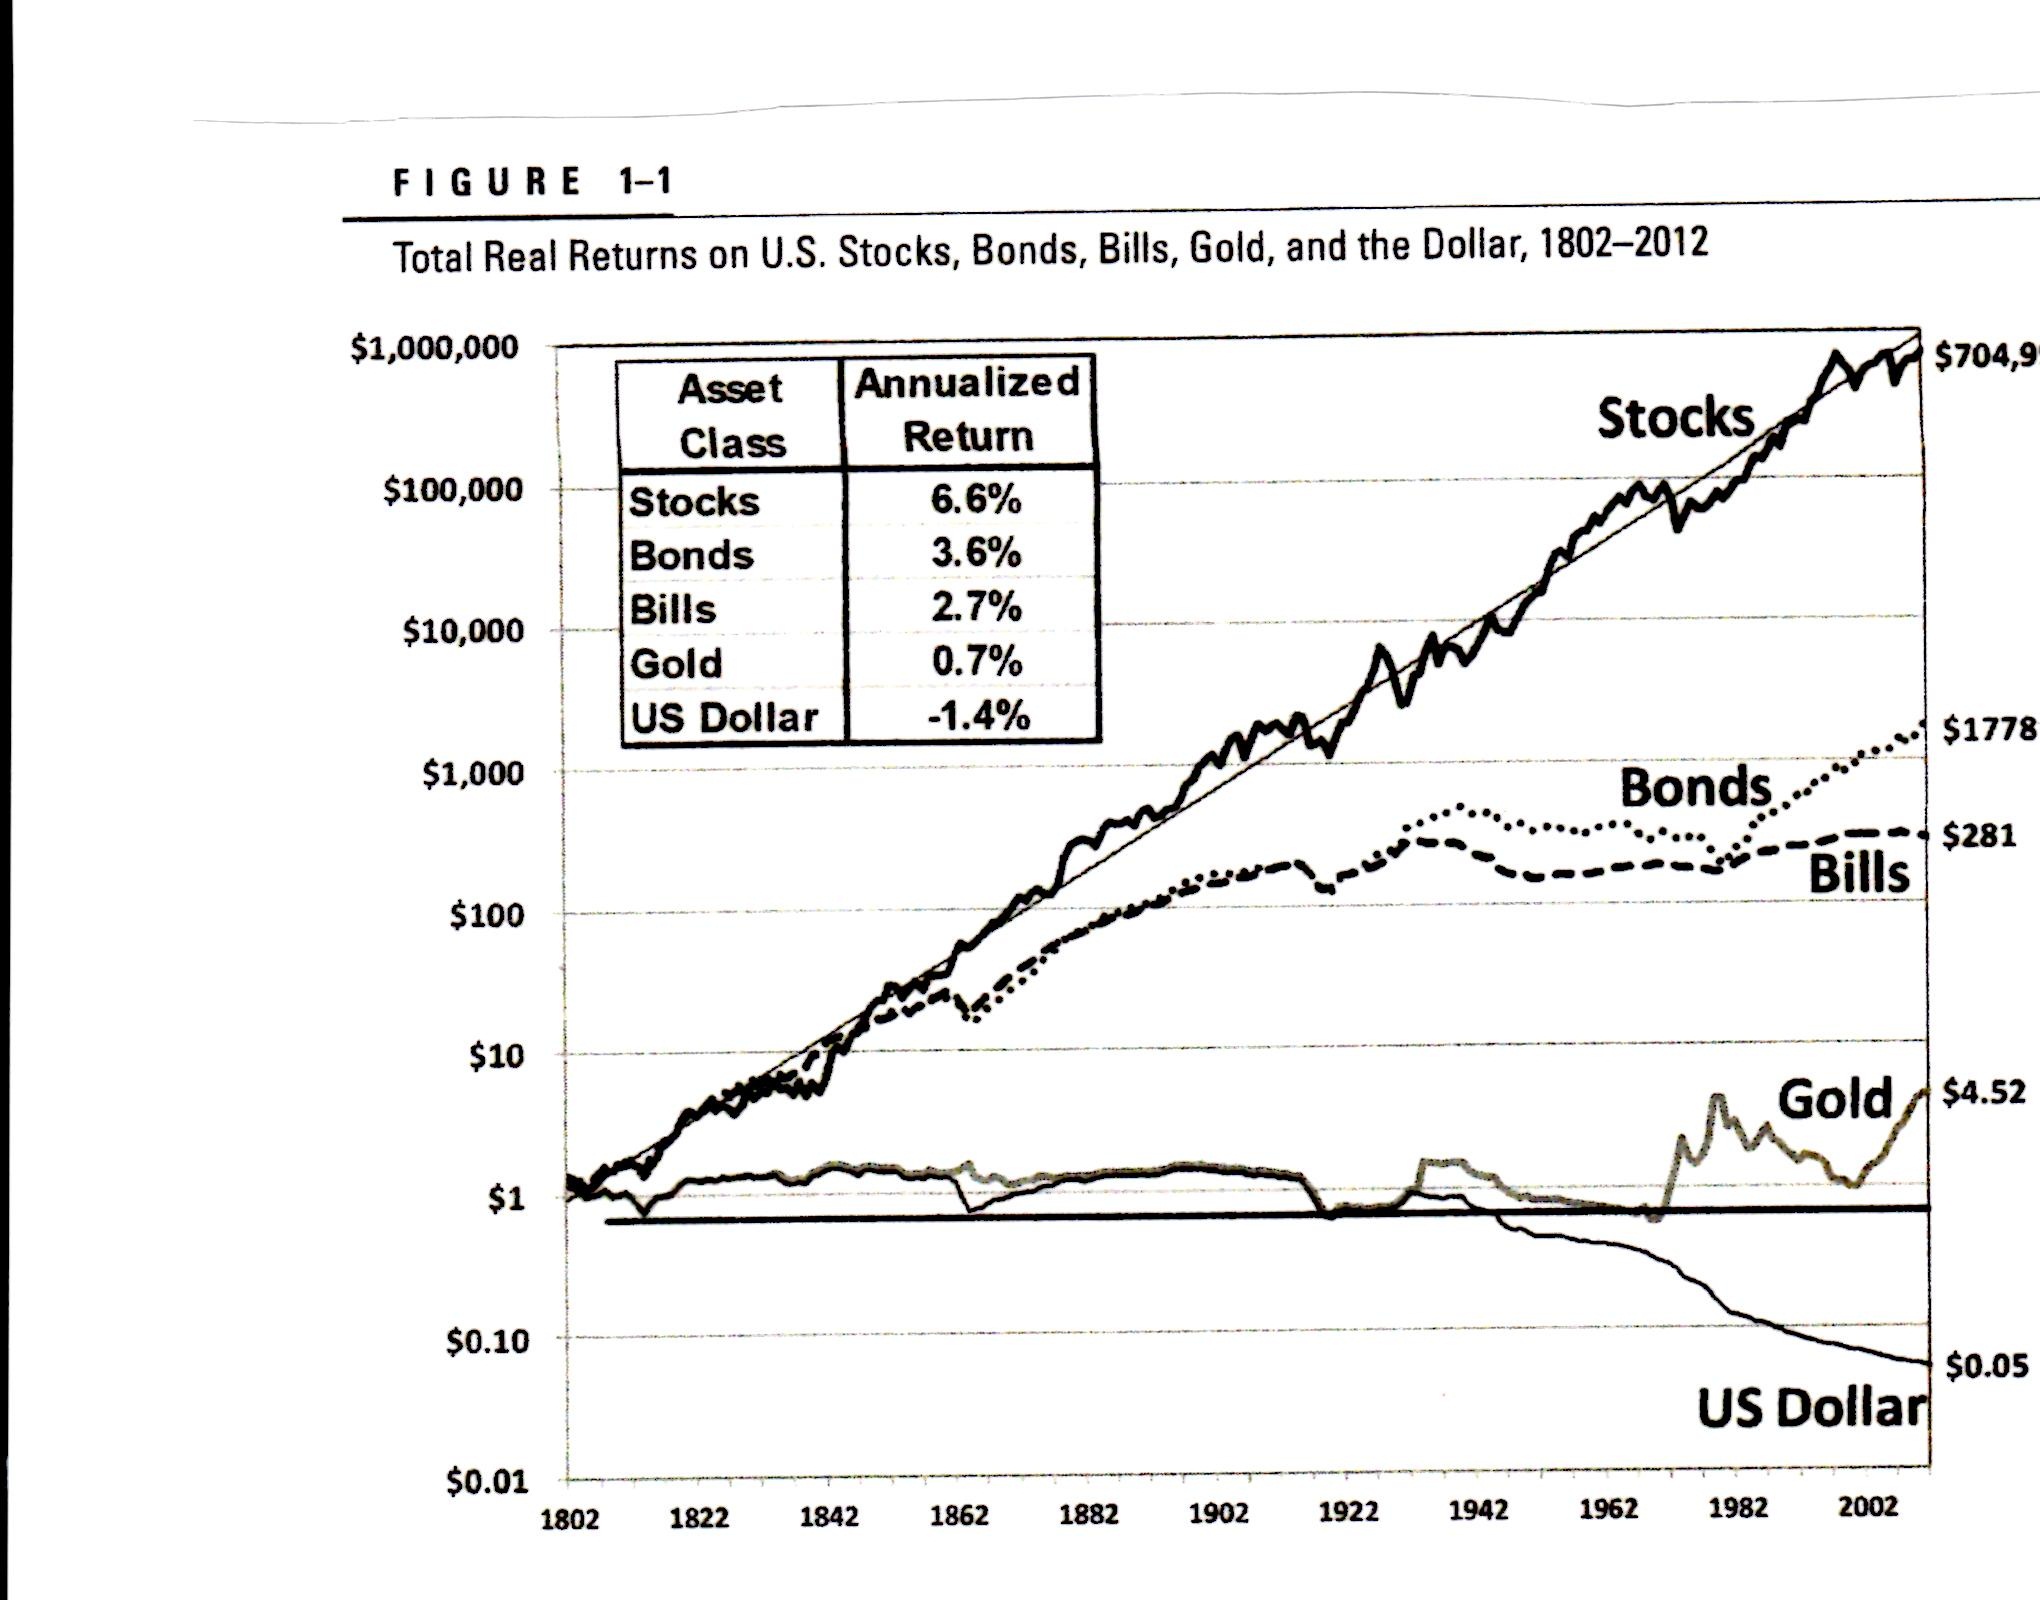
Replicate Figure 1.1. from Siegel for the following four assets:
Stocks (based on S&P 500 Total Return Index)
Government 10 year Bonds
Government Bills
Cash
Note that you are showing the real value of $1 invested in each asset class from 1946 to 2015, sothis is just a more recent version of Figure 1.1. Be sure to use a log scale also! Prepare a separate table summarizing the annualized real return of each asset over this entire period, using annual compounding, as discussed in lecture. (Don't put the table on the graph like Seigel does, but follow his convention of presenting the percent per year with one decimal value.)
Use your graph and table to address the following questions.
1. Explain how the S&P 500 Total Return Index is different from the S&P index, and what we are therefore assuming to get from $1 to the amount you derive in 2015.
2. Define the equity premium and determine its value over this period.
3. For each of the four assets, determine the nominal rate of return ?? and show that the real rate
of return ?? is related to the nominal rate by the formula 1 + ?? =1+?? /1+?? where π is the annual rate ofinflation based on the CPI.
4. Cash is a special asset. Explain the advantages and disadvantages of holding cash compared to the other assets.

Attachment:- comparison.xlsx