Reference no: EM13854885
1. A random sample is one ______
a. That is haphazard
b. That is unplanned
c. In which every unit of a particular size has an equal probability of being selected
d. That ensures that there will be no uncertainty in the
2. 10 students participate in Statistics quiz 2, their grades are:
98, 85,89,73,76,85,87,92,85,56 WHAT ARE THE:
MEAN,
MEDIAN,
MODE,
RANGE,
VARIANCE,
STANDARD DEVIATION,
INTER-QUARTILE RANGE (IQR)
3. For the scores 3, 5, 8, 10, 14, 17, 21, 25, calculate the 75th percentile using the following formula: R = P/100 x (N + 1) (BE CAREFUL IT'S NOT (a))
a. 6.75
b. 17
c. 21
d. 20
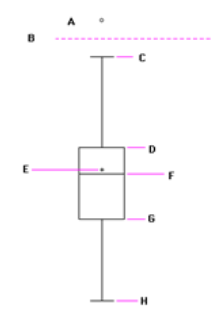
4. FOR THIS BOX PLOT TELL WHAT EACH LETTER (A - H) REPRESENTS:
5. A box of marbles contains: 20 red, 10 green, 12 yellow and 8 blue. After shaking the box, we randomly select 5 marbles WITHOUT REPLACEMENT (THIS IS IMPORTANT). What is the probability that the first is RED, the second is RED, the third is GREEN, the fourth is Yellow and the fifth is BLUE. (the two reds make this tricky)
5. If you throw a six sided die twice, what is the probability that you will get:
(a) A one on the first throw OR a two on the second throw ?
(b) A one on the first toss AND a two on the second toss of the die ?
6. Here are five letters: A, F, G, T, S
(a) How many 3-letter COMBINATIONS can you make from these 5 letters?
(b) How many 3-letter PERMUTATIONS can you make from these 5 letters?
(c) Would either number change if the "S" were replaced with a second "F"?
7. Consider a normal distribution with a mean of 25 and standard deviation of 4. Approximately, what proportion of the area lies between values of 17 and 33.
a. 95%
b. 68%
c. 99%
d. 50%
8. Convert the two x-values (raw data points 17 and 33) to standardized z-values and what are they? What is the standardized mean?
IF YOU GOT THIS ONE RIGHT, THEN YOU CAN SEE WHY WE USE AN ALPHA OF 5% TO SEPARATE THE PROBABLE FROM THE IMPROBABLE (WHERE WE REJECT THE NULL HYPOTHESIS FOR EXAMPLE, OR CONSIDER A VALUE "UNUSUAL")
REFER BELOW TO THE TABLE OF Z-SCORES (or find one on the web) AND CORRESPONDING AREAS UNDER THE NORMAL CURVE FOR THE FOLLOWING QUESTIONS (IGNORE THE CIRCLED VALUES). REMEMBER THAT Z-SCORES ARE THE NUMBER OF STANDARD DEVIATIONS FROM THE MEAN AND THAT FOR NORMALLY DISTRIBUTED DATA (LIKE THE MEANS OF SAMPLE MEANS) ABOUT 95% OF THE DATA FALL BETWEEN + 2 STANDARD DEVIATIONS FROM THE MEAN.
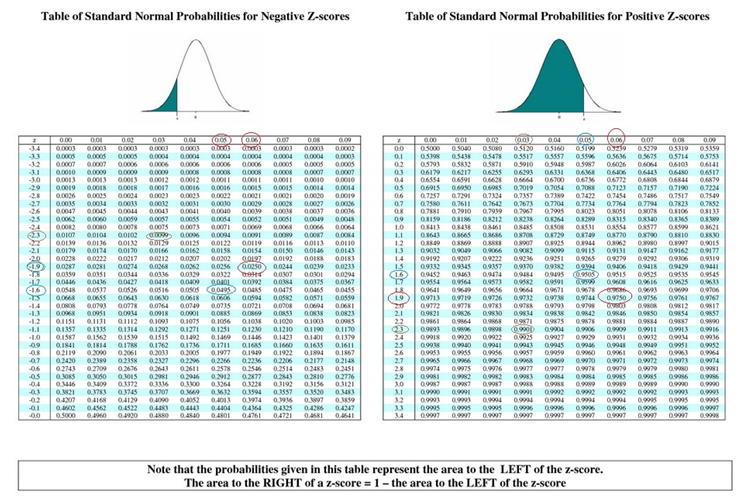
9. FOR A Z-VALUE OF +2.00 (TWO STANDARD DEVIATIONS) WHAT IS THE AREA (FROM THE TABLE ON THE RIGHT) THAT REPRESENTS THE PERCENT OF DATA TO THE LEFT OF IT?
NOW, WE MUST SUBTRACT THE SHADED AREA IN THE LEFT TAIL (GRAPH AND TABLE ON THE LEFT) AT Z = -2.00 FROM THIS LARGER AREA TO GET THE TOTAL PERCENT OF OUR DATA THAT IS WITHIN +2 STANDARD DEVIATIONS FROM THE MEAN. WHAT IS THIS RESULTING AREA (TO 4 DECIMAL PLACES 0.0000) ?
LET'S MOVE ON TO QUESTIONS ON HYPOTHESIS TESTING. (e.g., testing whether or not our sample reflects the true population statistic like the mean? There are other things we can test as you have done, but it all comes back to the above z-table or the t-Table with n-1 df)
10. We have a null hypothesis Ho and an alternate hypothesis Ha, which have to account for all possibilities. AND the null hypothesis MUST have the "equals" in it (not in the Ha)
So, if Ho: u > 50 then Ha is: u < 50 Is this a right, left or two-tailed hypothesis test?
If Ho: u = 32 and Ha: u ≠ 32 Is this a right, left, or two-tailed hypothesis test?
IF we have the population mean AND STANDARD DEVIATION, we can use the z-Table for a Normal Distribution
IF we have the population mean BUT NOT ITS STANDARD DEVIATION, we must use the t-Table and know the sample size to get the n-1 degrees of freedom. As the n increases (to about 1000) the shape of the t-Distribution gets wider and looks more and more like the Normal Distribution and the t-Table values get approximately the same as the z-Table values.
For a hypothesis test we must assume a significance level (PROBABILITY), alpha, that we will use to accept or reject our null hypothesis. The most common alpha is 5%, meaning that 5% (0.05) of the area under the Normal graph is to the RIGHT of a specific "critical" +z-score or +z-value for a RIGHT TAILED (+) test. If our calculated test statistic (calculated z-zcore) is LARGER THAN the critical +z-score, we are in the "rare", unlikely area, hence we would REJECT Ho.
11. NOW, WHAT IS THE CRITICAL +Z-SCORE THAT CORRESPONDS TO AN ALPHA OF 5% MEANING THAT 5% OF THE AREA OR PROBABILITY IS IN THE RIGHT TAIL MEANING THAT THE AREA TO THE LEFT OF THIS Z-SCORE IS 95% (100% - 5% = 95% or 1.00 - 0.05 - 0.95) OF THE TOTAL AREA) ? (USE THE RIGHT HAND TABLE ABOVE)
12. WHAT CRITICAL + Z-SCORE CORRESPONDS TO AN ALPHA OF 1% (0.01) MEANING THAT THE AREA (PROBABILITY) TO THE LEFT OF THIS Z-SCORE IS 99% OF THE TOTAL AREA?
NOTE THAT THE ABOVE + Z-SCORES ARE FOR RIGHT TAILED TESTS. IF THEY WERE FOR LEFT TAILED TESTS (E.G., Ha: u < 34) WE WOULD SIMPLY HAVE THE NEGATIVE VALUE OF THAT SAME Z-SCORE AND WOULD REJECT Ho IF OUR CALCULATED Z-ZCORE TEST STATISTIC WERE LESS THAN THAT CRITICAL VALUE (e.g., test -2.3 is less than critical -1.9, hence reject).
13. NOW, LET'S TALK ABOUT TWO-TAILED TESTS WITH AN ALPHA OF 5% SIGNIFICANCE (PROBABILITY). (THIS WOULD BE FOR Ha: u ≠ 34) WE MUST SPLIT THE ALPHA BETWEEN THE TWO TAILS, SO FOR A TOTAL ALPHA OF 5% WE WOULD HAVE a/2 OR 2.5% IN EACH TAIL. LOOKING AT THE + Z-SCORE FOR 2.5%, THIS WOULD MEAN THAT THE AREA TO THE LEFT (USE THE RIGHT HAND TABLE ABOVE) WOULD BE 1 - 0.025 = 0.975 OR 97.5% TO THE LEFT. WHAT IS THE CRITICAL +Z-SCORE THAT MARKS THIS AREA SPLIT?
14. WHAT IS THE CRITICAL Z-SCORE THAT MARKS THE TWO-TAILED, ALPHA = 1% (99% CONFIDENCE) SPLIT WITH 0.005 AT EACH END (0.995 TO THE LEFT OF THE +Z-SCORE) ?
15. FOR THE FOLLOWING RESULTS WOULD YOU ACCEPT OR REJECT Ho:
(a) CRITICAL +Z-VALUE = 1.65 AND CALCULATED Z-VALUE (TEST STATISTIC) = 1.67?
(b) +1.96 and +3.00 ?
(c) - 1.65 and -2.00 ?
(d) -1.96 and -1.94 ?
16. We are trying to predict students' final exam scores (Y') from their midterm exam scores (X). We know the mean score on the midterm term was 86 and its standard deviation was 5.0. The mean of the final exam was 80 and its standard deviation was 6.0. The correlation coefficient (r) between midterm exam scores and final exam scores was 0.3.
What's the slope of the regression?
What's the Y-intercept?