Reference no: EM131941527
Problem 1 -
Let
Perform the following operations in the order given:
a) Divide column 2 by √3.
b) Add the elements of the third row to the elements in the fifth row (the third row remains unchanged).
c) Multiply the elements of the first column by the corresponding elements of the fourth column and place the result in the first column.
d) Set the diagonal elements to 2.
e) Print the matrix z either row-wise or column-wise.
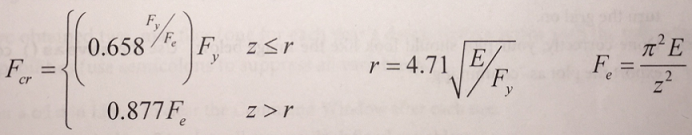
Problem 2 - In structural engineering, we calculate the capacity (also known as the "critical" buckling stress, Fcr) of a steel column based on the equations shown below.
Create a script with the following functionality (use semicolons to suppress all variables):
Enter a disc in Line 1 to clear the Command Window after each use.
Enter a clear in Line 2 to clear all previously defined variables.
Next, using steel properties for A992 steel, define the following variables within the script:
- E = 29000 ksi (elastic modulus) - [Use E as the variable name]
- FY = 50 ksi (yield stress) - [Use Fy as the variable name]
- Also, compute r (slenderness limit) - [Use r as the variable name]
Next, use the linspace () function to create a row vector of 500 values spaced evenly from 1 to 200. Assign this vector using z as the variable name.
Create two empty row vectors of 500 zeros each using the zeros () function. Assign one vector using Fe as the variable name and another using Fcr as the variable name.
Next, compute the elastic buckling stress using the rightmost formula above. Assign this vector using Fe as the variable name.
- Instead of using the "." operator, create a for-loop using k as the index variable. The loop should run from a value of k=1 to a value to k=500.
- After your loop is complete, Fe should still contain 500 terms.
In order to compute Fcr values, create an if-else statement nested in a for-loop with the following features (use k as the index variable):
- Use k as the loop index variable.
- The loop should run from a value of k=1 to a value to k=500.
- For each iteration, the nested if-else statement should determine whether or not z (k) is less than or equal to r. If this is true, then Fcr should be computed using the upper expression. If not, then Fcr should be computed using the lower expression.
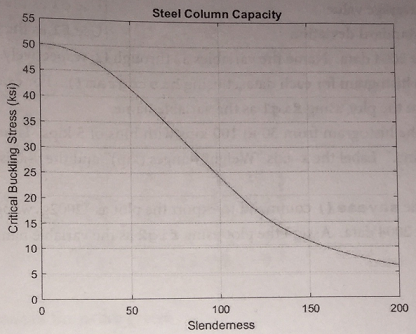
After your loop is complete, Fcr should still contain 500 terms. Plot the curve (use z as the x-axis data and Fcr as the y-axis data):
- Assign this plot using fig as the variable name.
- Title the chart as "Steel Column Capacity." Label the x-axis "Slenderness" and the y-axis "Critical Buckling Stress (ksi)."
- Plot such that the x-axis is bounded from 0 to 200 and the y-axis is bounded from 0 to 55. Also, turn the grid on.
- Done correctly, your plot should look like the image below. Use the saveas () command to export the plot as "column.jpg."
Problem 3 - Use the import data tool to import the data set representing weight-in-motion data collected for highway/bridge design purposes that was discussed during In-Class Exercise 3 (GVW.txt). Create and export two separate column vectors for each year's data. Name these column vectors Y2002 and Y2004, respectively. Save these vectors as .mat files and upload them into your network drive.
- Note: When you import the data, be sure to exclude the first row since that is the header row.
- Note: Also, set the "Unimportable Cells" option to "Exclude Rows With..."
- Also, in order to avoid errors, run the Import Data Wizard for the 2002 data, export the matrix using save, then run the Wizard again for 2004 data.
Once you've obtained two .mat files (one for each year's data), write a script with the following statistical analysis capabilities (use semicolons to suppress all variables):
Enter a clc in Line 1 to clear the Command Window after each use.
Enter a clear in Line 2 to clear all previously defined variables.
Next, load the data using load Y2002 and load Y2004, respectively, on Lines 4-5 (leave Line 3 blank).
Note: For this command to work, the .mat files must be in the same folder as your script!
For the 2002 data, write code to compute the following statistics.
- The total number of data points - [Use a1 as the variable name]
- The minimum value - [Use b1 as the variable name]
- The median value - [Use c1 as the variable name]
- The maximum value - [Use d1 as the variable name]
- The average value - [Use e1 as the variable name]
- The standard deviation - [Use f1 as the variable name]
Repeat for the 2004 data. Name the variables a2 through f2, respectively.
Finally, plot a histogram for each dataset using histogram (). For example, for the 2002 data:
- Assign the plot using fig1 as the variable name.
- Plot the histogram from 30 to 100 kips with bins of 5 kips. Title the chart as "2002 Gross Vehicle Weights." Label the x-axis "Weight Ranges (kip)" and the y-axis "Frequency." Also, turn the grid on.
- Use the saveas () command to export the plot as "2002gvw.jpg.
Repeat for the 2004 data. Assign the plot using fig2 as the variable name.
Attachment:- Assignment Files.rar