Reference no: EM132958869
UBGMUA-15-M Nonlinear Structural Analysis - University of the West of England
Task 1 - Pushdown analysis of an Reinforced Concrete (RC) column
Consider a reinforced concrete (RC) column of height h = 3 m subjected to a compressive axial load as shown in Fig.1. The assumed stress-strain model curves of the column constituent materials, concrete and steel, are shown in Figs.2(a)and2(b). For the concrete curve, the 1-2 region can be described by
σc = Ec (εc - Ecεy - σy/Ecε2y)ε2c (1.1)
where Ec, σc and εc are the concrete's Young's modulus, compressive stress and strain, respectively. σy is the concrete yield stress and the concrete yield strain is given as εy = 2 × 10⁻³. where Ec, σc and εc are the concrete's Young's modulus, compressive stress and strain, respec- Note that in reality concrete does not have a yield stress, but such engineering simplification is useful when attempting to model its behaviour. Using the regular and modified Newton- Raphson (NR) methods determine the capacity curve of the column, i.e. develop a push-down
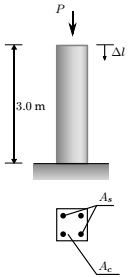
Figure 1: RC column subject to a vertical point load (top) and its cross-sectional area (bottom).
load analysis, considering the nonlinear behaviour of its materials. The following workflow is suggested
1. Write the nonlinear equations of equilibrium of the RC column in the two main segments of its stress-strain curve, based on the material laws of its constituent materials
2. Create two load-based Newton-Raphson routines, regular and modified, which will for increasing load steps P1, P2, . . . , Pn compute the corresponding displacements of the column top Δl1, Δl2, . . . , Δln
3. Plot the capacity curves P vs ?l of the column with both variants of the NR method, and set their limits to the displacement associated with the given ultimate strain εu = 3.5 × 10⁻³
Most of the geometry and material parameters shown in Figures1and2are an example for illustration - you have been assigned an individual problem, with a set of geometric and material properties that are individual to you and are listed in Table1.
Your report for this task should include 4 sections have used; (30 %)
Description of the problem, its formulation and description of the algorithms that you contributes to the column's overall resistance (20 %)
A discussion of how the capacity curve develops, and how each of the two materials capacity curve, namely in terms of accuracy vs computational efficiency;
A discussion of the advantages and disadvantages of each method when retrieving the capacity curve, namely in terms of accuracy vs computational efficiency
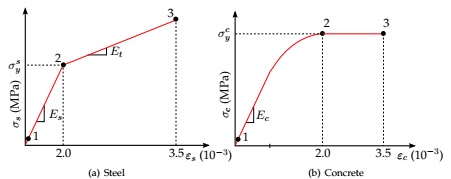
Figure 2: Stress-strain material model curves.
Comments on how the material models could be further improved to obtain a more realistic capacity curve
The results must also be evidenced by source programming code file(s)/spreadsheet(s).
Task 2 - Research on finite element pushover analysis
The RC column analysed in Section1has been loaded vertically until it reached material failure-also known as a pushdown analysis. In component A of this module you will have instead to design a nonlinear structure against seismic events, using a horizontal load-also known as a pushover analysis.
In preparation for this piece of work, carry out an independent research related to nonlinear finite element (FE) modelling of structures and discuss the relative merits of the approach for seismic performance based design.
Your report for this task should include 3 sections practice;
A short introduction to the method and how widely it has been accepted in professional which have been put forward up to date;
A brief literature review of the topic, including latest developments/enhancements
A conclusion highlighting your expectations for the task that lies ahead of you;
Attachment:- Nonlinear Structural Analysis.rar