Reference no: EM132339167
Processing Text Assignment -
Instructions - There are six exercises below. You are required to provide solutions for at least four of the six using R. Please confirm which one you would be solving. Please share the output files. You are required to solve at least one exercise in R, and at least one in SAS. If you choose SAS for an exercise, you may use IML, DATA operations or PROC SQL at your discretion.
Exercise 1 - Write a loop or a function to convert a matrix to a CSV compatible string. Given a matrix of the form
|
C1
|
C2
|
C3
|
|
a
|
b
|
c
|
|
d
|
e
|
f
|
|
g
|
h
|
i
|
produce a string of the form
a,b,c\n,d,e,f\n,g,h,i
where \n is the newline character.
You are only required to convert a matrix to CSV format, but you may choose to write code to convert data tables to CSV; in this case, include column names in the output string. Use NATR332.DAT as a test case.
NATR332.DAT <- data.frame(
Y1 = c(146,141,135,142,140,143,138,137,142,136),
Y2 = c(141,143,139,139,140,141,138,140,142,138)
)
If you choose SAS, I've include the NATR332 data table and framework code for IML in the template. I used the CATX function in IML. I found I could do this in one line in R, with judicious use of apply, but I haven't found the equivalent in IML. Instead, I used a pair of nested loops to "accumulate" an increasingly longer string.
Exercise 2 - Create an ordered treatment pairs table from the pumpkin data. Before printing the table, iterate over each row to create a vector of row names that are more descriptive. First, use levels to get the text associated with each Class, then combine the Class text to create a row name of the form:
Blue vs Cinderella
(where Blue is the Class description for class 1, Cinderella is the description for class 2. This text should be the row name in the row corresponding to i = 1 and j = 2). You may choose to add a column with the specified descriptions, if you wish, but this must be the first column of the printed table.
Exercise 3 - Calculate MSW, MSB, F and p for the data from Wansink Table 1 where
MSB = ∑ini(xi-x-)2/(k-1)
MSW = ∑i(ni-1)si2/(N-k)
Start with the strings:
Means <- "268.1 271.1 280.9 294.7 285.6 288.6 384.4"
StandardDeviations <- "124.8 124.2 116.2 117.7 118.3 122.0 168.3"
SampleSizes <- "18 18 18 18 18 18 18"
Tokenize the strings, then convert the tokens to a create vectors of numeric values. Use these vectors to compute and print MSW, MSB, F and p.
If you use SAS, I've provided macro variables that can be tokenized in either macro language or using SAS functions. You can mix and match macro, DATA, IML or SQL processing as you wish, but you must write code to convert the text into numeric tokens before processing.
Compare your results from previous homework, or to the resource given in previous homework, to confirm that the text was correctly converted to numeric values.
Exercise 4 - Repeat the regression analysis, but start with the text
Rate <- "Rate | 23000 | 24000 | 25000 | 26000 | 27000 | 28000 | 29000"
Yield <- "Yield | 111.4216 | 155.0326 | 181.1176 | 227.5800 | 233.4623 | 242.1753 | 231.3890"
Note that by default, strsplit in R will read split as a regular expression, and | is a special character in regular expressions. You will need to change one of the default parameters for this exercise.
Tokenize these strings and convert to numeric vectors, then use these vectors to define
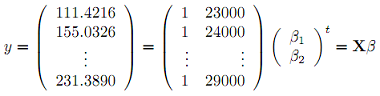
Solve for and print βˆ.
If you use SAS, I've provided macro variables that can be tokenized in either macro language or using SAS functions. You can mix and match macro, DATA, IML or SQL processing as you wish, but you must write code to convert the text into numeric tokens before processing.
Compare your results from previous homework, or to the resource given in previous homework, to confirm that the text was correctly converted to numeric values.
Exercise 5 - Use the file openmat2015.csv from D2L. This is a list of top-ranked high school wrestlers in 2015, their high School, Weight class and in some cases the College where they expected to enroll and compete after high school.
We wish to know how many went on to compete in the national championship in 2019, so we will merge this table with the data from Homework 7, ncaa2019.csv. The openmat2015.csv data contains only a single column, Name. You will need to split the text in this column to create the columns First and Last required to merge with ncaa2019.csv.
Do not print these tables in the submitted work Instead, print a contingency table comparing Weight for 2015 and Weight for 2019. What is the relationship between high school and college weight classes? You may instead produce a scatter plot or box-whisker plot, using high school weight class as the independent variable.
If you do this in SAS, use the openmat2015SAS.csv file, it will import College correctly.
Exercise 6 - Use file openmat2015.csv from Exercise 6, and use partial text matching to answer these questions. To show your results, print only the rows from the table that match the described text patterns, but to save space, print only Name, School and College. Each of these can be answered in a single step.
- Which wrestlers come from a School with a name starting with St.?
- Which wrestlers were intending to attend an Iowa College?
- Which wrestlers were intending to start College in 2016 or 2017 (College will end with 16 or 17)?
- Which wrestlers are intending compete in a sport other than wrestling? (look for a sport in parenthesis in the College column. Note - (is a special character in regular expressions, so to match the exact character, it needs to be preceded by the escape character \. However, \ in strings is a special character, so itself must be preceded by the escape character.
Attachment:- Processing Text Assignment Files.rar