Reference no: EM13977674
Traffic Modeling
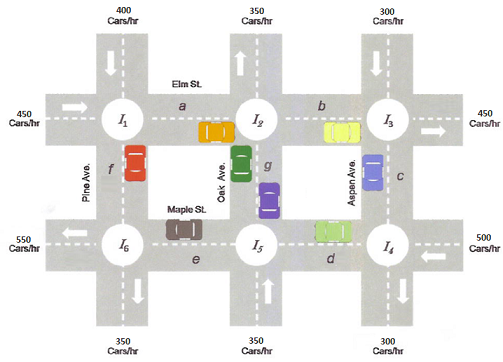
Figure 1 shows the intersections of five one-way streets and the number of cars that enter each intersection from both directions. For example, I1 shows that 400 cars per hour enter from the top and that 450 cars per hour enter from the left. See the Applications section in Section 6.2 of College Algebra as a reference.
For this assignment, use Figure 1 to answer the questions following the figure and to prepare a Microsoft® PowerPoint® presentation.

Figure 1. The intersections of five one-way streets
The letters a, b, c, d, e, f, and g represent the number of cars moving between the intersections. To keep the traffic moving smoothly, the number of cars entering the intersection per hour must equal the number of cars leaving per hour.
1. Describe the situation.
2. Create a system of linear equations using a, b, c, d, e, f, and g that models continually flowing traffic.
3. Solve the system of equations. Variables f and g should turn out to be independent.
4. Answer the following questions:
a. List acceptable traffic flows for two different values of the independent variables.
b. The traffic flow on Maple Street between I5 and I6 must be greater than what value to keep traffic moving?
c. If g = 100, what is the maximum value for f?
d. If g = 100, the flows represented by b, c, and d must be greater than what values? In this situation, what are the minimum values for a and e?
e. This model has five one-way streets. What would happen if the model had five two-way streets?
|
Graph that represent variation of tangential acceleration
: Three different expressions for the centripetal acceleration as a function of time are given for an object moving in a circle. In each case, determine the graph that best represents the variation of the tangential acceleration with time.
|
|
Confidence interval for population mean credit card debt
: Sallie Mae researchers report that the average college junior has a credit card debt of $2912. Under the assumption that this finding was based on the sample data in file XR09040, construct and interpret the 99% confidence interval for the populat..
|
|
Confidence interval for the population mean
: The novices required an average time of 105 minutes, with a standard deviation of 20 minutes. Construct and interpret the 90% confidence interval for the population mean time it would take all such novices to complete this task.
|
|
Do you think the class-action lawsuits have merit
: Would you expect Lucent's earnings to 'recover' by the second quarter of 2000? What obstacles to Lucent's earnings recovery present themselves?
|
|
Create a system of linear equations
: Describe the situation. Create a system of linear equations using a, b, c, d, e, f, and g that models continually flowing traffic
|
|
Calculating the confidence interval for the population mean
: Given this information, and assuming the data are from a normally distributed population, construct and interpret the 95% confidence interval for the population mean amperage these fuses will withstand.
|
|
Confidence interval for the population mean
: Given this information, and assuming the data are from a population that is approximately normally distributed, construct and interpret the 90% confidence interval for the population mean:
|
|
Find direction of magnetic force acting on positive charge
: A solenoid (figure B) has a radius 0.125 meters, length 1.8 meters, and 600 turns of wire. If the current in the solenoid is 35 amps, calc the magnitude of the magnetic field in the solenoid.
|
|
Computing the confidence interval for the mean
: Construct and interpret the 95% confidence interval for the mean.
|