Reference no: EM131399341
Case Study presented data on the fastest speed that men and women had driven a car, and dotplots were shown for each sex. Data for the men are also in the pennstate1M dataset on the companion website.
a. Create a stem-and-leaf plot for the male speeds.
b. Create a histogram for the male speeds.
c. Compare the pictures created in (a) and (b) and the dotplot in Case Study. Comment on which is more informative, if any of them are, and comment on any other differences that you think are important.
d. How would you describe the shape of this dataset?
Case Study
Who Are Those Speedy Drivers?
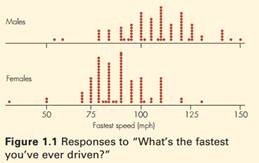
A survey taken in a large statistics class at Penn State University contained the question "What's the fastest you have ever driven a car? mph." The data provided by the 87 males and 102 females who responded are listed here.

From these numbers, can you tell which sex tends to have driven faster and by how much? Notice how difficult it is to make sense of the data when you are simply presented with a list. Even if the numbers had been presented in numerical order, it would be difficult to compare the two groups.
Your first lesson in statistics is how to formulate a simple summary of a long list of numbers. The dotplot shown in Figure 1.1 helps us see the pattern in the data. In the plot, each dot represents the response of an individual student. We can see that the men tend to claim a higher "fastest ever driven" speed than do the women.
The graph shows us a lot, and calculating some statistics that summarize the data will provide additional insight. There are a variety of ways to do so, but for this example, we examine a five-number summary of the data for males and females. The five numbers are the lowest value; the cut-off points for one-fourth, one half, and three-fourths of the data; and the highest value. The three middle values of the summary (the cutoff points for one-fourth, one-half, and three fourths of the data) are called the lower quartile, median, and upper quartile, respectively. Five-number summaries can be represented like this:
|
|
Males (87 Students)
|
Female (102 Students)
|
|
Median
|
110
|
89
|
|
Quartiles
|
95
|
120
|
80
|
95
|
|
Extremes
|
55
|
150
|
30
|
130
|
Some interesting facts become immediately obvious from these summaries. By looking at the medians, you see that half of the men have driven 110 miles per hour or more, whereas the halfway point for the women is only 89 miles per hour. In fact, three-fourths of the men have driven 95 miles per hour or more, but only one fourth of the women have done so. These facts were not at all obvious from the original lists of numbers.
Moral of the Story: Simple summaries of data can tell an interesting story and are easier to digest than long lists.
Definitions: Data is a plural word referring to numbers or nonnumerical labels (such as male/female) collected from a set of entities (people, cities, and so on). The median of a numerical list of data is the value in the middle when the numbers are put in order. For an even number of entities, the median is the average of the middle two values. The lower quartile and upper quartile are (roughly) the medians of the lower and upper halves of the data.
|
What would you advise the doctor to do
: "After reading the case, assume you are a lawyer, your client, a medical doctor has been approached by the parents of a mentally retarded female child to medically sterilize the child. She comes to you for advice. What would you advise the doctor ..
|
|
Explain a famous athlete who leads their team to victory
: Explain a famous athlete who leads their team to victory? The leader of a successful business? A recognized national or international political leader? An historical figure who made a major difference?
|
|
Statement that creates a two-dimensional list
: Write a statement that creates a two-dimensional list with 5 rows and 3 columns. Then write nested loops that get an integer value from the user for each element in the list.
|
|
Critically examine the behaviour of sovereign bonds
: Critically examine the behaviour of sovereign bonds in the Eurozone from at least two different interest rate theoretical perspectives
|
|
Create a stem and leaf plot for the male speeds
: Create a stem-and-leaf plot for the male speeds.- Create a histogram for the male speeds.- Compare the pictures created in (a) and (b) and the dotplot in Case Study.
|
|
Understanding the mechanisms of trust
: In today's hyper-connected society, understanding the mechanisms of trust is as important as understanding electricity was a century ago. Issues of trust and security are critical to solving problems as diverse as corporate responsibility, global ..
|
|
Does good health lead to happiness
: Write a brief, 200-250 word informal response (about 1-page) in which you answer the research question, "Does good health lead to happiness, or happiness lead to good health-or neither?"
|
|
The teaching and learning of diffusion and osmosis
: Suppose you are interested in the behaviors of college professors that have high ratings of student satisfaction. The research goal is to identify the teaching behaviors of these successful professors so that these behaviors can be built into the ..
|
|
Explain result from your analysis of the roi business majors
: Write a minimum 4 page report explaining the results from your analysis of the ROI of Business Majors and Engineering Majors. Use your results from each week's assignment to make this report.
|