Create a simulink model for the scara robot depicted

Assignment Help Simulation in MATLAB
Reference no: EM13960648

Brief

Create a Simulink Model for the SCARA robot depicted in figures 1 and 2. The motor specification is appended to this brief.

You will need to create a subsystem to model the motors taking into account that the inertia of Arms 1 and 2 combined is not a constant but depends upon the orientation of Arm 2
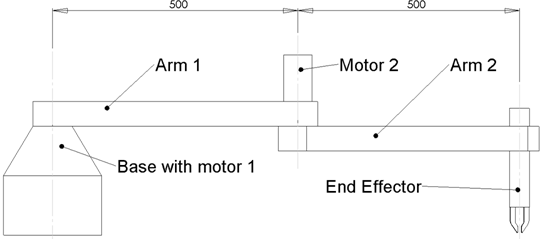
702_Side view of SCARA Robot.png

Figure 1: Side view of SCARA Robot

The inertial load experiences by motor 1 depends upon the position of the centre of mass of Arm 2 which varies with angle, a, in figure 2.

2315_Side view of SCARA Robot1.png

Figure 1: Top view of SCARA Robot showing relative angle, a, between Arm 1 and Arm 2

Data

The specifications of the robot parts for the simulation are: (MI = moment of inertia)

Arm 1

Mass                               m1                0.39 kg

Centre  of  mass               COM      0.25 m along length MI  about  COM                                      10-3  kg m2

MI about motor 1 axis    0.035 kg m2

Motor 2

Mass                                     mm               0.3 kg

MI  about  axis                 0.0012 kg m2 Therefore can be treated as a point mass MI about motor 1 axis    0.075 kg m2

Both motors are M543E as shown on the data sheet

Arm 1 with Motor 2

MI about motor 1 axis    0.11 kg m2

Arm 2

Mass                                     m1                0.39 kg

Centre  of  mass               COM      0.25 m along length MI  about  COM        5 X 10⁻⁴  kg m2

MI about motor 2 axis 0.035 kg m2 Angular   range -150 o   to +150o

End Effecter

Mass                                     me                0.35 kg

MI  about  axis                 0.00007 kg m2 Therefore can be treated as a point mass MI about motor 2 axis    0.09 kg m2

Arm 2 with End Effecter

Mass                                     m2                0.74 kg

Centre  of  mass               COM      0.366 m along length MI  about  COM                                      0.024 kg m2

MI about motor 2 axis    0.123 kg m2

Inertia at Motor 1

This is dependent upon the orientation of Arm 2. From figure 2, the distance, r, of the COM of Arm 2 to the axis of motor 1 can be evaluated:

r2  = (r1  + r2  cos a)2  + r22 sin 2  a

= r12 + 2r1r2cos2a + r22 cos2a + r22 sin2a

= r12 + 2r1r2cosa + r22 

= r12 + r22 + 2r1r2 cos a

Where r1 = 0.5 m; r2 = 0.366 m and a is the angle of Arm 2 relative to its local coordinate system, and so:

r2 = 0.384 + 0.732 cosa

And using parallel axis theorem, the MI experienced by motor 1 from Arm 2 plus the end effecter is:

I2  = 0.024 + 0.74r2 kgm2

plus the inertia of Arm 1.

Write a report describing your model and present results on a series of tests on the model. In your conclusions, present an evaluation of the model in the light of all assumptions made and what limitations they place on the model. Also evaluate the robot based on the tests and present recommendations as to the suitability of the design and choice of motors.

The report must be in the form of a standard technical report or article to include:

Abstract Introduction

Include explanations of continuous modelling, transfer functions for DC motors with references to form a literature review.

Methods

Describe your modelling technique and the structure of the model. Justify your approaches to building the model and include any relevant references. If you include a conditioner, for example a PID controller, describe the background to such an approach and the methods of tuning.

Discussion

Discuss the model and robot performance for all the tests and their implications on the real system. Explain the reasons for how motor 1 responds.


Attachment:- Assignment Brief.rar

Reference no: EM13960648

Questions Cloud

Critically examine keynesian theory of employment : Critically examine Keynesian theory of employment?
Calculate seasonally adjusted monthly sales : Calculate seasonally adjusted monthly sales by the ratio to trend method for the last six months of 1992
Suppose a knowledge base contains just one : Suppose a knowledge base contains just one sentence Эx As High As (x, Everest). Which of the following arc legitimate results of applying Existential Instantiation?
Find the diameters and the thickness of the rim : A rim type flywheel has to store the greatest amount of energy of 2.5 kJ at the mean engine speed of 300 rpm. The fluctuation of speed is not allowed to exceed 1.5% of the mean and the mass of the flywheel is 500 kg. Assuming the flywheel to be of..
Create a simulink model for the scara robot depicted : Create a Simulink Model for the SCARA robot depicted - The motor specification is appended to this brief - create a subsystem to model the motors taking into account that the inertia of Arms 1 and 2 combined is not a constant but depends upon the..
Number of chairs and sofas that maximize revenue : Solve the linear programming problem graphically to find the number of chairs and sofas that maximize the revenue. On your graph indicate clearly the feasible region, the optimal point, an arbitrary isoprofit line, and the isoprofit line correspon..
Range of feasibility-sensitivity range : For a maximization problem, assume that a constraint is binding. If the original amount of a resource is 4 lbs., and the range of feasibility (sensitivity range) for this constraint is from 3 lbs. to 6 lbs., increasing the amount of this resource ..
The dimensions of the guide : The cutoff frequency for TE11 mode if the guide is filled with a lossless material having εr = 2.25 and μr = 1.
Describe your company, its location, and the product : Determine the primary and secondary target markets for your company. Next, analyze the primary and secondary target markets that you identified for your company. Be sure to cover the 4Ps, 5Cs and STP.

Reviews

Write a Review

Simulation in MATLAB Questions & Answers

  Calculate the stress intensity factor

Use the three-parameter zone finite element method or the boundary collocation method to calculate the stress intensity factor K, at the crack tip for the plate

  Build a simulation using newtons laws of motion

Build a new and different simulation of your own using Newtons laws of motion and Show the code and describe how it works

  Write the specification of load mover

Write the specification of LOAD MOVER detailed of the whole design and precise for automatic control section and divide the design into various modules and Is the kernel required if yes which one?

  Design the automatic control section using statecharts

Aim of this project is to design an embedded system which can move loads from one place to another. The system can be operated manually, automatically and wirelessly.

  Need an expert who can model a drill in simulink

Need an expert who can model a drill in Simulink. Working model of a drill needing for an improvment to behave more realistically as a drill to drill through plastic block.

  Project is on load frequency control using fpid

Project is on load frequency control using FPID tuned using GA and PSO algorithm and the system is a two area system.

  Number of packets received with time

Let x be the number of packets received with time -

  Build a matlab based graphical user interface

Build a Matlab based graphical user interface (GUI) that operates in conjunction with a base Matlab/ Simulink simulation program. Any base simulation is considered acceptable.

  Build a matlab based graphical user interface

Build a Matlab based graphical user interface (GUI) that operates in conjunction with a base Matlab/ Simulink simulation program. Any base simulation is considered acceptable.

  Simulate the standardised sum of independent

Simulate the standardised sum of independent and identically distributed variates - Fit a linear regression model as in Q5, and plot your estimates for β0 and β1 as N increases, together with a line indicating their true values. Supply your code.

  Plot the original periodic square wave

Plot the original periodic square wave on the same graph. Comment on the difference between the original periodic square wave and its truncated Fourier series presentation.

  Use matlab to plot the function

Plot the original periodic square wave on the same graph. Comment on the difference between the original periodic square wave and its truncated Fourier series presentation.

Free Assignment Quote

Assured A++ Grade

Get guaranteed satisfaction & time on delivery in every assignment order you paid with us! We ensure premium quality solution document along with free turntin report!

All rights reserved! Copyrights ©2019-2020 ExpertsMind IT Educational Pvt Ltd