Create a scatterplot and a line fitting the data

Assignment Help Algebra
Reference no: EM131930863

Often times, neither a line nor quadratic function is a good fit for the data, and so a higher order polynomial function is needed (as in the tiger population example illustrated in the overview of this module). This is one of the main applications of polynomials, to use them to find a curve that best fits the data, in what is called the "least squares" sense. This line of best fit is also called a regression line.

206_Scatter Plot.jpg

The model obtained can be used not only to make predictions but also to illustrate behavior between the independent and dependent variables. While the idea is essentially the same no matter what order of polynomial is used, in this activity, we will focus on the simplest case, the linear function, y = mx + b, which is a 1st -degree polynomial.

Please read through this discussion and think about these questions as you proceed through the next few sections. When you have a good understanding of the concepts, begin your search for the data needed to answer the questions below. When you are confident with your research and outcomes, return to this discussion and post a thorough response to one of the following questions.

Now, let's begin our graphing discussion:

1. Consult an almanac, newspaper, magazine, or the Internet to find data that appear to lie approximately on or near a straight line. A few of the many free sources of data that might be appropriate to use are attached:

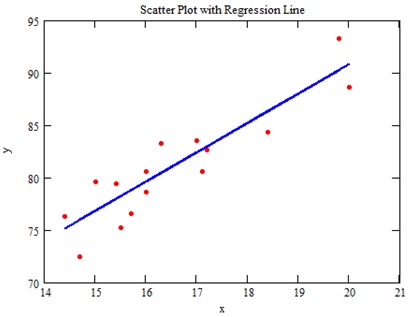
2. Create a scatterplot and a line fitting the data in one of two ways:

a. To do this activity by hand, create a scatterplot by plotting the (x, y) data in a Cartesian (rectangular) coordinate system. Then, draw a line that approximately fits the data in the scatterplot, and then write its equation as a function in slope-intercept form. An easier way, and one that produces better looking results, is to find the equation of the line for your data using this free, online linear regression calculator:

b. To use the regression calculator:

Enter your data, but without parentheses ( ), in the empty data field

When all of your data points are entered, click on the "Submit Data" button. The line of best fit y = mx + b for your data will be displayed, as will a figure showing a scatterplot of your data and the graph of your line of best fit.

Right-click on the displayed figure of the scatterplot/graph and save it to your computer. Then, load it into the discussion box when you make your post. To do that, click on the image button in the palette of the discussion text-editor window. In that menu, you load the figure from your computer into your post.

3. Also include a link to your data, along with an explanation of what the x and y axes represent in your graph.

Part 2 if this were present

1.) Consider the data and regression line if present and try to explain some of the possible reasons for the observed variation, that is, what are some of the possible reasons the points do not all fall on the line? For example, if we were to plot the number of births of a certain species of bird each year (dependent variable) vs. the annual rainfall in inches (independent variable) in their habitat that year, we will find a linear, though not perfectly so, relationship. The reason for the variation (vertical offset from the line) may be in part because, for lower than average rainfall there could be a food shortage.

Attachment:- wk.rar

Verified Expert

When the random variable takes a finite number of values, then the distribution involved will be discrete probability distribution. For example, tossing two coins and counting the number of heads turned up is an example of discrete probability distribution

Reference no: EM131930863

Questions Cloud

Create a feasible research design that includes plans : Create a feasible research design that includes plans for the sample selection, data collection, and data analysis. Apply ethical principles to your design.
Discuss bias opinion polls and bias questions : Discuss Media Bias. Discuss bias Opinion Polls and bias questions. Political Issues. You must use one source from each side to receive credit.
Reduce sex segregation : What are some specific individual and organizational steps that could help reduce sex segregation
Define civil liberties and civil rights : Which civil sequence has more influence on your life as you know it to be now? Why do you believe this to be so?
Create a scatterplot and a line fitting the data : Create a scatterplot and a line fitting the data in one of two ways - A few of the many free sources of data that might be appropriate
Explain how contingency models of leadership enhance : Explain how contingency models of leadership enhance our understanding of effective leadership and management in organizations.
Effective leadership and management in organizations : Explain how contingency models of leadership enhance our understanding of effective leadership and management in organizations
Summarize the background of the terrorist organization : Discuss if the organization identifies with left wing views, right wing views, or other political ideology and why.
Traditional project management environment : What would a project manager mainly focus on when doing risk management in an agile environment that they would not likely focus on in a traditional project

Reviews

Write a Review

Algebra Questions & Answers

  The vertex and axis of symmetry

The vertex and axis of symmetry.

  Solve the given function using row reduction

A) Find domain B) x and y intercepts C)horizontal and vertical asymptotes E) increase and decrease F) concavity and G) points of inflection. Solve the following using row reduction.

  Over what intervals are the given functions continuous

Over what intervals are following functions continuous? Let f and g be twice differentiable functions such that f'(x) ≤ 0 for all x in domain of f. If h(x) = f(g(x)) and h'(2) = 4. What (if anything) can you say about f, g, and h at x = 2?

  Solution of an inequality

Solution of an inequality.

  System of three linear equations that represents the data

Let x be the cost of a CD of type A, y be the cost of a CD of type B, and z be the cost of a CD of type C. Write a system of three linear equations that represents the data in the table.

  Use the midpoint formula determine the midpoint between the

1. use the midpoint formula. find the midpoint between the following points.a14 and b56.a4 6 and b-2 -2a3 -4 and b5

  How many of each type of seat are there on the plane

An airplane has a total of 152 seats. The number of coach-class seats is 5 more than six times the number of first-class seats. How many of each type of seat are there on the plane?

  Find both the point-slope form and the slope-intercept

Find both the point-slope form and the slope-intercept form of the line with the given slope which passes through the given point. The graph of y = f(x) is given below. Use it and Theorem 1.7 to graph the given transformed function.

  Find the orthogonal projection p of e^x onto x

Consider vector space C[0,1] with scalar product: for any two functions f(x), g(x)

  Define the term multiplicative function

State a formula for tau (n), the number of divisions of n, in terms of the collected prime factorization of n.

  Find the coordinates of the point of intersection

The sum of two numbers is 54, and their difference is nine more than the smaller number. Find the numbers.

  Express as a polynomial

Express as a polynomial

Free Assignment Quote

Assured A++ Grade

Get guaranteed satisfaction & time on delivery in every assignment order you paid with us! We ensure premium quality solution document along with free turntin report!

All rights reserved! Copyrights ©2019-2020 ExpertsMind IT Educational Pvt Ltd