Create a graph of the us gdp

Assignment Help Macroeconomics
Reference no: EM1394622

Part-1

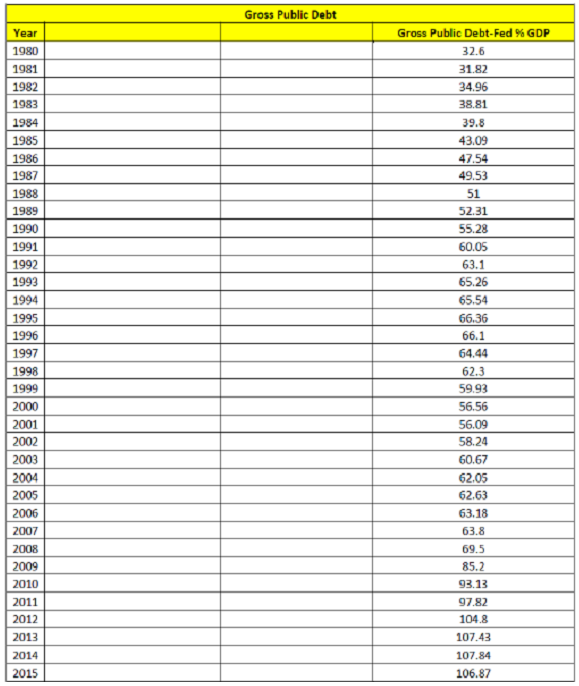
1. Utilizing the link below and the instructions to follow, create a graph of the US GDP relative to Debt from the period 1981 to 2010.

Utilizing the DATA below and the instructions to follow, create a graph of the US GDP relative to Debt from the period 1981 to 2010.

1677_create a graph of the US GDP.png

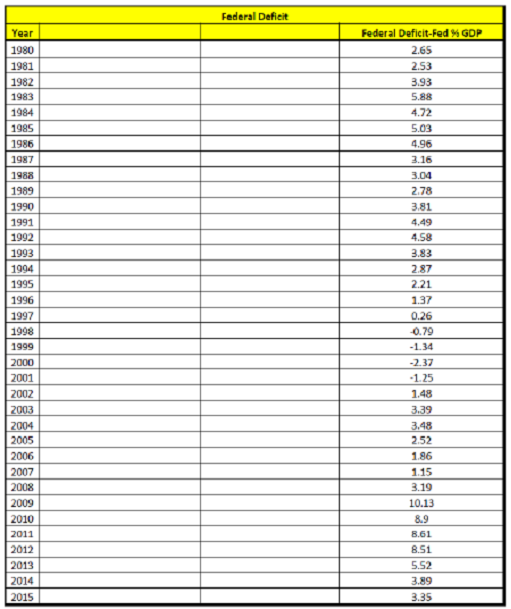
2. Utilizing the same link below, create a graph of the US GDP relative to the US deficit spending for the same 30 year period.

Ut thing the same DMA below, create a graph of the US GOP relatrre to the US clef ic it 'rendre r or the same 30 year period.

800_create a graph of the US GDP1.png

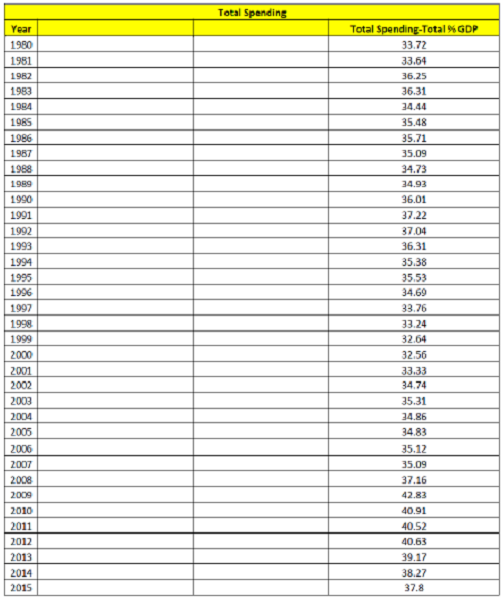
3. Utilizing the same link below, create a graph of the US GDP relative to US spending for the same 30 year period. Utilizing the same link below. a sale a graph ol the US GDP relatisse to US spending lor the tante 30 year period.

1566_create a graph of the US GDP2.png

Part 2

The next three pertain to analyzing and companng the charts from above during these time periods

1981 to 1991 1992 to 2000 2001 to 2008 2009 to 2010

Question 1:

Compare and interpret the four periods regarding the deficit spending. Focus on the changes in the percentages during each period.

Question 2:

During the specific periods above, explain the variations in the debt Give specific analysis of each period and a logical explanation of the variations.

Question 3:

Explain the Federal spending from the four periods, focus on the huge variations from 2009 and 2010 and the periods of 1981 and 1982. Also, explain the reduction in percentage of Federal spending during the 1991. to 2000 period.

Reference no: EM1394622

Questions Cloud

Local unemployment rate : Your mayor just announced that the local unemployment rate dropped last month from the prior month. It went from 10.5% to 10.4%. Is this a significant drop? Explain.
Explain latest fiber optics leading wireless manufacturers : Your job is to appoint the sales manager to sell your latest fiber optics to leading wireless manufacturers of five main companies.
How many gm of dry nh4cl need to be combined : How many gm of dry NH4Cl need to be combined to 2.30L of a 0.300M solution of NH3, to prepare a buffer solution of pH 8.85.
Sample variances-pooled variances : One sample has SS = 48 and a second sample has SS = 32. When both samples have n =5, what is each sample variance and computed pooled variance?
Create a graph of the us gdp : Utilizing the link and the instructions to follow, create a graph of the US GDP relative to Debt from the period 1981 to 2010.
Study of cardiovascular risk factors : A recent study of cardiovascular risk factors reports that 30% of adults meet the criteria of hypertension. if 15 adults are assessed, what is the probabiliy that?
Find parents genotype for the gene responsible for yuck : A made-up disease called YUCK only develops in individuals who are homozygous recessive for that gene. An individual with the YUCK disease has parents that do not have this disease
Prepare a schedule of factory overhead costs : Prepare a schedule of factory overhead costs for Sunny corporation for the year ended december 31 2005. Using the following data.
What mass of au is produced : What mass of Au is produced when 18.6 ampere of current are passed through a gold solution for 29.0 minutes.

Reviews

Write a Review

Macroeconomics Questions & Answers

  Illustrate what happens to bicycle supply

Illustrate what happens to bicycle supply. What happens to bicycle demand.

  Explain how a voluntary exchange result

Explain how a voluntary exchange results in a win/win situation to both parties.

  Chinese economic growth

As seen during financial crisis of the 1930s and in history, markets are globally interconnected. Aside from financial markets, different countries have different resources.

  Elucidate the impact of an increase in production technolog

In the Keynesian, Classical, as well as Solow model, Elucidate the impact of an increase in production technology

  Elasticity of demand and marginal revenue

Using above demanded schedule, find out the elasticity of demand for each price change. (Example: when price changes from $5 to $10, quantity demanded changes from 1000 to 800 oz., so the elasticity of demand, by using average values, is 1/3 or 0...

  Estimating equilibrium price and quantity

Suppose perfect competition. Yoland is a small nation that takes world value of corn as given. Its domestic supply and demand for corn is given by the following;

  Finding slope of budget line and consumers mrs

Show the new utility maximizing bundle of gasoline and all other goods. What is the slope of the new budget line? What is the consumer's new MRS of all other goods for gasoline?

  When is international job an opportunity for workers

When is international job an opportunity for workers. When is it a threat to workers. What are some of the major challenges confronting the international trading system.

  The subsequent table gives total output or total product

The subsequent table gives total output or total product as a function of labor units used. Does the table indicate a situation of diminishing returns.

  Difference among national income-gross national product

Illustrate what is the difference among National Income, Gross National Product, and Gross Domestic Product? Why do most countries now use GDP as a measure of national output?

  Compute the equilibrium price and quantity

Important information about Regression anaylsis. Compute the equilibrium price and quantity.

  Illustrate what is internal rate of return for the college

Illustrate what is the internal rate of return for the college investment that this person faces. Write out the equation used to evaluate the net benefit.

Free Assignment Quote

Assured A++ Grade

Get guaranteed satisfaction & time on delivery in every assignment order you paid with us! We ensure premium quality solution document along with free turntin report!

All rights reserved! Copyrights ©2019-2020 ExpertsMind IT Educational Pvt Ltd