Reference no: EM132400898
The Friendly Skies? In-Class Data Exercise
1. Opening and browsing the dataset
The dataset that you will use for this assignment is called "airline_prices.dta". These data are a random sample of all recent round-trip airline tickets purchased for travel between New York's John F. Kennedy Airport (JFK) and Los Angeles (LAX). First-class fares have been excluded. For each ticket the data include the carrier (i.e. the airline), the round-trip fare, and several other variables. Take a look at the variables "advance", "busclass", and "nonrefundable". What does each variable measure and how does each variable measure it?
2. Central tendency
Create a detailed summary statistics table for the variable "rtrip_fare".
a. What is the mean of the variable? What is the median?
b. The mean is larger than the median. What does this indicate?
3. Heterogeneity
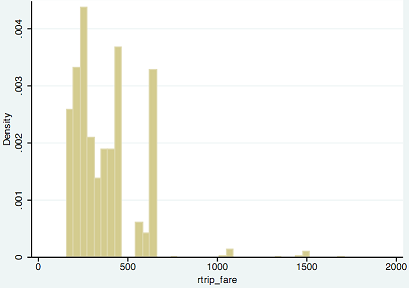
A histogram is a plot of the distribution of a numerical variable. Create a histogram for "rtrip_fare".
a. Use your best artistic abilities to sketch the histogram below. Why is there so much white space on the right side of the histogram?
b. Make another histogram using only tickets under $1000. Use your best artistic abilities to sketch the histogram.
c. Go back to the full dataset. Is one of the airlines much cheaper on average than the other? Provide the relevant statistics.
d. The "satstayover" variable is a 0/1 variable. Take a look at the prices of tickets with "satstayover" equal to 0 and equal to 1. What do you think this variable measures and how do you interpret the price difference?