Reference no: EM13861183
Question:
Suppose that you are working for a manufacturing company and want to visualize the types of defects that are occurring along with how many times each defect occurs. See the (ATTACHED FILE) for the DATA
Tasks:
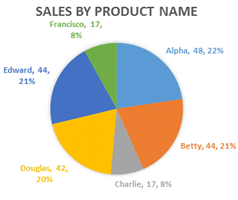
1. In Excel, create a pie chart and a bar chart with an appropriate vertical axis, horizontal axis, and title.
2. Copy and paste each chart into a word document.
3. The attached file contains an example of what the final chart should look like,
4. Titles and numbers will be different. (DO NOT JUST COPY THE ATTACHED CHART) Remove PROFESSOR''S Chart examples and INSERT THE PIE CHART AND BAR CHART YOU CREATED WITH DIFFERENT TITLES AND NUMBERS.
5) Include Excel File showing the created pie chart and bar chart with the vertical axis, horizontal axis and title when You submit the Proposal back to me
Part 1:
Resources that will help:
Pie, Column, Bar, Line and X-Y Scatter: https://www.youtube.com/watch?v=-btUxQi76qI
Pareto Chart:https://www.excel-easy.com/examples/pareto-chart.html
Suppose that you are working for a manufacturing company and want to visualize the types of defects that are occurring along with how many times each defect occurs. See the data below.
|
Defect
|
Number of Defects
|
|
Misplaced transistors
|
601
|
|
Wrong component
|
212
|
|
Defective board dimension
|
146
|
|
Components not adhering
|
143
|
|
Circuitry problems on final test
|
90
|
|
Excess adhesive
|
71
|
|
Mounting holes improperly positioned
|
12
|
1. In Excel, create a pie chart with an appropriate vertical axis, horizontal axis, and title. Copy and paste the chart into this document below. Below is an example of what your final chart should look like, although your titles and numbers will be different. Remove my example and insert your own.
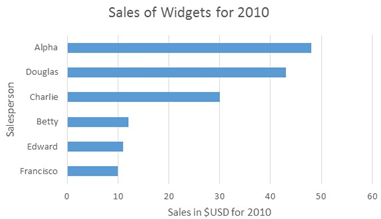
2. In Excel, create a bar chart with an appropriate vertical axis, horizontal axis, and title. Copy and paste the chart into this document below. Below is an example of what your final chart should look like, although your titles and numbers will be different. Remove my example and insert your own.
Part 2:
Resources that will help: https://www.youtube.com/watch?v=DTMxjANGvcU
Complete the following tables and upload with answers included.
You will find the Excel file titled "Retirement Funds". Inside this file is a listing of types of fund and their returns over a specific number of years. There are four types of funds presented, including a) Large Growth, b) Large Value, c) Mid-Cap Growth, d) Mid-Cap Value, e) Small Growth, and f) Small Value. Please answer the following questions.
|
Fund Type
|
Average
|
Standard Deviation
|
Minimum
|
Maximum
|
Quartile 1
|
Quartile 3
|
Skewness
|
|
Large Growth
|
|
|
|
|
|
|
|
|
Large Value
|
|
|
|
|
|
|
|
|
Mid-Cap Growth
|
|
|
|
|
|
|
|
|
Mid-Cap Value
|
|
|
|
|
|
|
|
|
Small Growth
|
|
|
|
|
|
|
|
|
Small Value
|
|
|
|
|
|
|
|
|
What is the purpose of being so exact with the betas
: The Countrywide Corporation in charge of the organization where I work has as of late distributed a report expressing that the levered beta of the area of vitality transportation is 0.471870073 (yes, 9 decimals). They acquired this number by consider..
|
|
Draw a graph of jane''s marginal benefit from corn
: Draw a graph of Jane's marginal benefit from corn. Draw a graph of the production possibility possibilities frontier on Jane's Island.
|
|
What is the purpose of being so exact with the betas
: The Countrywide Corporation in charge of the organization where I work has as of late distributed a report expressing that the levered beta of the area of vitality transportation is 0.471870073 (yes, 9 decimals). They acquired this number by consider..
|
|
Explore the elements of emotional intelligence that leaders
: Explore the elements of emotional intelligence that leaders must be aware of to increase leadership effectiveness
|
|
Create a bar chart with an appropriate vertical axis
: Create a bar chart with an appropriate vertical axis, horizontal axis, and title - what your final chart should look like, although your titles and numbers will be different. Remove my example and insert your own.
|
|
What types of risks should bondholders
: 1. What types of risks should bondholders be aware of and how do these affect bond prices and yields? 2. How much would you pay for a Treasury bill that matures in 182 days and pays $10,000 if you require a 1.8%
|
|
Research paper on the people vs antwion thompson
: Research paper on The People vs. Antwion Thompson, Are the social benefits of protecting the constitutional rights of the accused outweighed by the potential loss of evidence when a criminal defendant either chooses not to make a statement
|
|
What is the effective interest rate
: Please help me with the areas in bold below but if you can assist on the entire problem and explain it in detail that would be great :)On January 2013, Professor Xin buys a house. Here is the information
|
|
How people from africa both slaves and freemen
: At least five distinctive subgroups that belong under this broad category, How people from Africa, both slaves and freemen, became part of the Latino population in Mexico, Central and South America, and the U.S.
|