Create a 2d graph by plotting multiple data series

Assignment Help Computer Engineering
Reference no: EM132369685

Workshop Assignment

PART 1 – MATLAB Graphics (2D)

Create a 2D graph by plotting multiple data series on the same axes, using a resolution of at least 0.1 between points. Choose your axis limits so that all mathematical functions show at least 3 full iterations. Ensure all axes are labelled, and each data series has a different line style, marker and colour.

• y1 = ƒ(x) = sin(x⁄2)

• y2 = ƒ(x) = 3 cos(x⁄5)

• y3 = ƒ(x) = 2 tan(x⁄8)

PART 2 – MATLAB Graphics (3D)

Using the surface plot approach for plotting functions in two variables (see meshgrid and surf), plot the following two functions side-by-side, as subplots on the same figure, using a resolution of 0.1 showing from -5 to 5. Ensure all axes are labelled and use the colormap called cool. Use the Rotate 3D tool to get the angle that best shows the waveforms (subjective – student just needs to show how to change the view angle).

• z1 = ƒ(x, y) =  xy ((x2−y2)/ (x2 + y2))

• z2 = ƒ(x, y) = 10 cos√(x2 + y2)

PART 3 – Create functions for plotting motion in 1D

Create 3 functions to plot the output of motion in 1D using inputs tmax, s0, v0, and ac. These input values correspond to the time, starting displacement, starting velocity and constant acceleration experienced in the motion. Use the constant acceleration equations from the dynamics portion of Lecture 6 and create functions that plot displacement (plot_s), velocity (plot_v) and acceleration (plot_a).

In each function, you will need to use a time vector (1D array) to denote the time step starting from t = 0 to t = tmax in increments of 0.1. Then use a same-sized vector in each function, to denote the displacement/ velocity/ acceleration to be plotted. Ensure your plots have a title and both axes labelled. See Part 4 for an example of the kind of plot required (minus the GUI for now).

PART 4 – GUI for Interactive 1D motion plots

In this part, you are going to create a MATLAB Graphical User Interface (GUI) using GUIDE. Before you start, read the following websites which give you all the information you need to finish this part.

• Create a Simple UI Using GUIDE

• GUIDE Components

• Callbacks for Specific Components

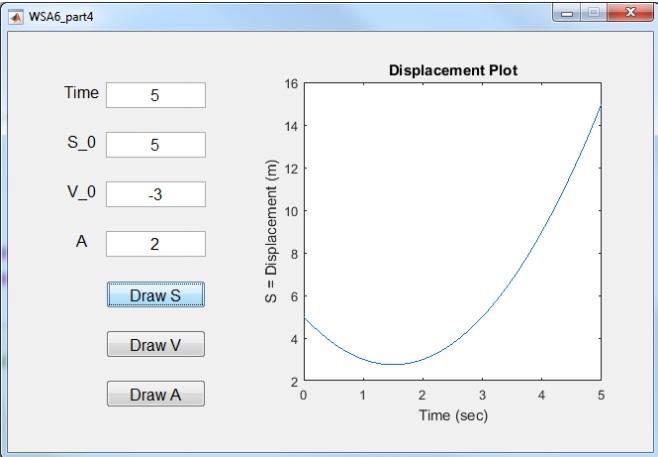
The GUI you need to create uses the code from the functions written in Part 3. You do not need to call the functions from Part 3, rather you will need to use the code inside callback faunctions. Your GUI should allow a user to input values for inputs t, s0, v0, and ac, and then the user can press one of three buttons to update the graph with either S-, V- or A- plot. Your GUI should use the following UI components:

• Edit Text

• Static Text

• Axes

• Push Button

Some components may be used several times. An example of what the GUI may look like is below

734_Part 4.jpg

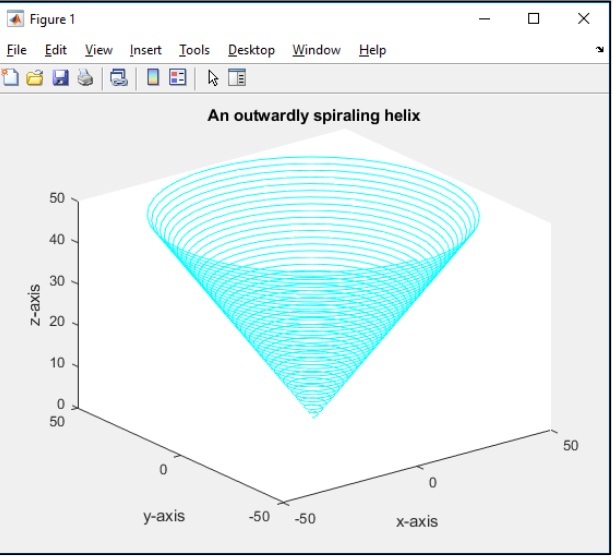
PART 5 – BONUS Problem – Animated 3D helix

For the bonus part, you will need to create an animated 3D plot of an outwardly spiralling Helix.

Your helix will consist of the helix equations below, drawn at intervals of t = 0.01 until the z axis reaches 50.

x(t) = t cos(5t)

y(t) = t sin(5t)

z(t) = t

Your plot must be drawn in cyan colour and needs axis names and title as given, right. To animate the spiral, your plot will need to be updated every 5 one-hundredths of a second – showing another t = 0.01 along the spiral – and your entire animation should last approximately 16 seconds.

For an example of how your animated 3D plot should look, see the video in the workshop6 zipped file on Moodle.

161_Part 5.jpg

Reference no: EM132369685

Questions Cloud

Discussion on equipment and product safety topic : Project Topic - Equipment and Product Safety. Develop a PICO(T) question based on project Topic above and follow instructions below.
What type of classroom management concerns might you have : Reflect on the on-site learning environment. As a nurse educator, what type of classroom management concerns might you have about teaching in on-site situations
Strayer library to research articles on hypothesis test : Use the Internet or Strayer Library to research articles on hypothesis test and its application in business.
Examine effective verbal and written communication : Examine effective verbal and written communication; utilizing communication skills of the professional role to promote and improve quality and safety.
Create a 2d graph by plotting multiple data series : ENGG100-Engineering Computing and Analysis-University of Wollongong-Australia-Create a 2D graph by plotting multiple data series on the same axes.
Describe the intentional strategies in brief : Maria is a 48-year-old white female who is recently divorced. She is not doing well in her love life and comes to you to get some immediate help because.
How you can use trauma informed care to assist a child : Explain Trauma Informed Care in detail. How you can use Trauma Informed Care to assist a child who has been impacted by trauma?
Basis for financial risk management strategy : Financial managers make use of derivatives, such as options, forwards, futures, and swaps as the basis for a financial risk management strategy.
Determine how the disorder impacts the population : Mental illness in the community does not discriminate. It can impact women, men, young children, adolescents, the elderly, and any nationality.

Reviews

Write a Review

Computer Engineering Questions & Answers

  Mathematics in computing

Binary search tree, and postorder and preorder traversal Determine the shortest path in Graph

  Ict governance

ICT is defined as the term of Information and communication technologies, it is diverse set of technical tools and resources used by the government agencies to communicate and produce, circulate, store, and manage all information.

  Implementation of memory management

Assignment covers the following eight topics and explore the implementation of memory management, processes and threads.

  Realize business and organizational data storage

Realize business and organizational data storage and fast access times are much more important than they have ever been. Compare and contrast magnetic tapes, magnetic disks, optical discs

  What is the protocol overhead

What are the advantages of using a compiled language over an interpreted one? Under what circumstances would you select to use an interpreted language?

  Implementation of memory management

Paper describes about memory management. How memory is used in executing programs and its critical support for applications.

  Define open and closed loop control systems

Define open and closed loop cotrol systems.Explain difference between time varying and time invariant control system wth suitable example.

  Prepare a proposal to deploy windows server

Prepare a proposal to deploy Windows Server onto an existing network based on the provided scenario.

  Security policy document project

Analyze security requirements and develop a security policy

  Write a procedure that produces independent stack objects

Write a procedure (make-stack) that produces independent stack objects, using a message-passing style, e.g.

  Define a suitable functional unit

Define a suitable functional unit for a comparative study between two different types of paint.

  Calculate yield to maturity and bond prices

Calculate yield to maturity (YTM) and bond prices

Free Assignment Quote

Assured A++ Grade

Get guaranteed satisfaction & time on delivery in every assignment order you paid with us! We ensure premium quality solution document along with free turntin report!

All rights reserved! Copyrights ©2019-2020 ExpertsMind IT Educational Pvt Ltd