Reference no: EM132340392
Data and Information Management Assignment - Data Modelling and Managing Data in Databases
Purpose of the assessment (with ULO Mapping) - The purpose of this assignment is to develop skills in managing data in databases and to gain understanding of data model development and implementation using a commercially available database management system development tool.
On completion of this assignment students will be able to:
a. Model organisational information requirements using conceptual data modelling techniques.
b. Convert the conceptual data models into relational data model and verify their structural characteristics with normalisation techniques.
Assignment Description -
Part A: Data Modelling
1. The snapshot of Car_HireDB database structure of "Rent a car" company is given in Figure 1.
This is a car renting business and database collects information about customers, cars and details of booking made online.
For each booking system assigns unique booking ID, and stores date of hire and date on which the vehicle is to be returned and payment received (amount). Customers make their payments at the time of booking. A customer cannot hire a car for longer than a week.
You are working as an IT specialist in this organisation and are required to extract information from this database by executing SQL queries according to the instructions given below.
The primary keys are marked in the Car_HireDB database, shown in figure1.
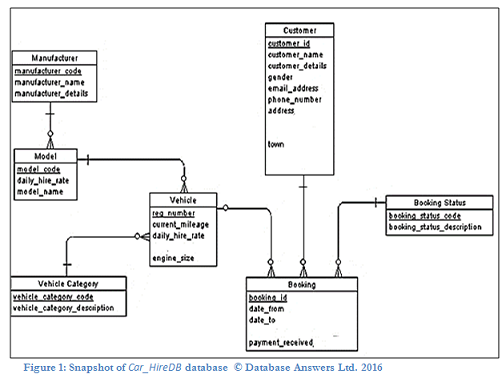
a. First you need to create the above database in MS Access. Create only 4 tables Customer, Booking, Vehicle and Booking_status.
b. And populate those tables with suitable data (at least 3 records per table).
i. You can use Datasheet view in MS Access or SQL statement (as given below) to enter suitable data records.
INSERT into TableName
VALUES ("..","..",.....)
ii. Include Proper foreign keys to create relationships in between tables.
Hint: If you want to create a one-to-many relationship in your database include one side primary key in the many side table as foreign keys.
Eg. In order to create one-to-many relationship between Customer and Booking, include Custiomer_id in Booking table.
Write SQL queries for the following questions.
Execute the queries on the "Car_HireDB" database you created in MS Access. Include screen shots of the outputs and all SQL statements you used to answer following questions:
c. Prepare a list of all the records in the "Booking" table where Payment_received is greater than $500. You are required to sort the list in descending order of "Payment_received".
d. Assume that you want to count how many vehicles are there with engine capacity higher than or equal to 1500 CC in the vehicle table. Write a query to find the number.
e. Display customer_id, customer_name,phone_number, booking_id, and payment_received for all customers who paid more than $1000 in the Booking table (Hint: Join Customer table and Booking table ).
2. Figure 2 shows the ER diagram that captures important information about customers, supplier and orders in car parts business.
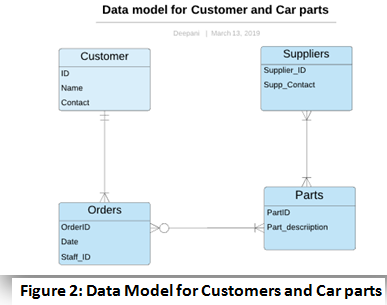
a. Convert the ER diagram into a relational database schema. Be certain to indicate primary keys (underline). Eg. Suppliers (SupplierID:Number; Supp_contact: Number)
NB: You are required to identify many-to-many relationships in the ER diagram and include Associative / Bridge entities.
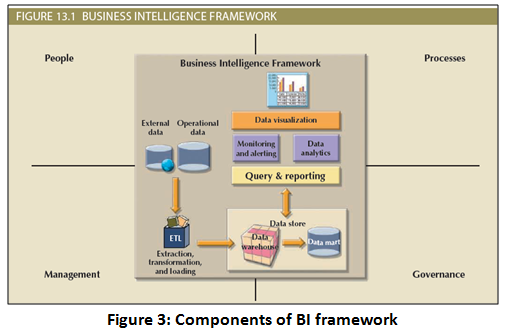
3. Business intelligence (BI) uses tools and processes to capture, collect, integrate, store, and analyse data to generate and present information to support business decision making. Components of the BI framework are given in the Figure 3 (Refer: Chap 13 -Database Systems: Design, Implementation, & Management -By Carlos Coronel and Steven Morris).
Answer following questions.
a. Briefly describe the term "Business Intelligence".
b. Describe the term "Data Analytics" and why it is important in Business Intelligence.
c. Create 2 Data visualisations using Tableau. Use data provided in "Resources/ Sample Data" section in the Tableau.
First you need to install Tableau App. Instructions are given below.
Tableau is a data visualization tool. Tableau can help anyone see and understand their data. Connect to almost any database, drag and drop to create visualizations. Install Tableau Public on your laptop / computer and create any 2 visualisations.
Part B - Performance Evaluation
Demonstrate your progress to your tutor in week 7 or week 8 lab classes.
This will allow students to demonstrate their understandings and skills (to their teacher) as they perform these activities. You are evaluated by the teacher on the quality of your ability to perform specific tasks and the products you create in the process. Your final mark for this assignment will be calculated based on this evaluation as describe below.
Attachment:- Data and Information Management Assignment File.rar