Reference no: EM132982424
Question 1. A recent survey of college freshmen investigated the amount of involvement their parents have with decisions concerning their education. When asked about the decision to go to college, 84% said their parents' involvement was about right, 10.3% said it was too much, and 5.7% said it was too little. When it came to selecting individual courses 72.5% said their parents' involvement was about right, 3.5% said it was too much, and 24.0% said it was too little. (MB Marklein, "Study: Colleges shouldn't Fret over Hands-on Parents," www.usatoday.com January 23, 2008. What additional information would you want to know about the survey before you accepted the results of the survey?
Question 2. A manufacturer of cat food was planning to survey households in Australia to determine the purchasing habits of cat owners. Among the variable to be collected are the following:
i. The primary place of purchase for cat food.
ii. Whether dry or moist cat food is purchased.
iii. The number of cats living in the household.
iv. Whether any cat in the household is pedigreed.
a) For each of the four items listed, indicate whether the variable is categorical or numerical. If the variable is numerical, is it discrete or continuous? Give reasons for your answer.
b) Develop four categorical questions for the survey.
c) Develop four numerical questions for the survey.
Question 3. Each day at a large hospital, several hundred laboratory tests are performed. The rate at which these tests are done improperly (and therefore need to be re-done) seems steady at about 4%. In an effort to get to the root cause of these non-conformances, tests that need to be re-done, the director of the lab decided to keep records over a period of one week. The laboratory tests were subdivided by the shift of workers who performed the lab tests. The results were as follows:
Shift
Lab Tests Performed Day Evening Total
Nonconforming 16 24 40
Conforming 654 306 960
Total 670 330 1000
a) Construct contingency tables based on total percentages, row percentages and column percentages.
b) Which type of percentage - row, column or total - do you think is the most informative for this data? Give reasons for your answer.
c) What conclusions concerning the pattern of nonconforming laboratory tests can the laboratory director reach?
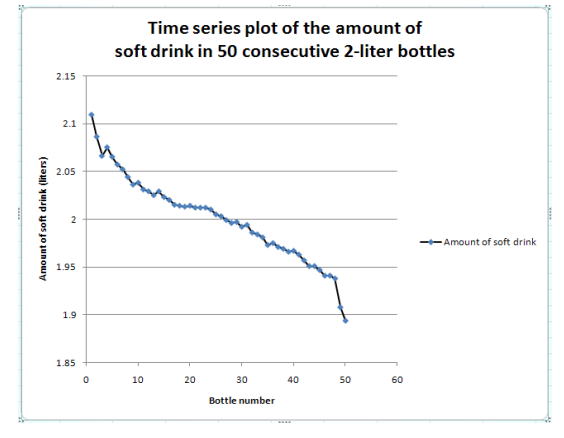
Question 4.The following time series plot gives the amount of soft drink in a sample of 50 consecutively filled 2-liter bottles.

(a) What pattern, if any, is present in these data?
(b) If you had to make a prediction about the amount of soft drink filled in the next bottle, what would you predict?
(c) Based on observing the above graph and the results for (a) and (b), explain why it is important to construct a time-series plot and not just a histogram.
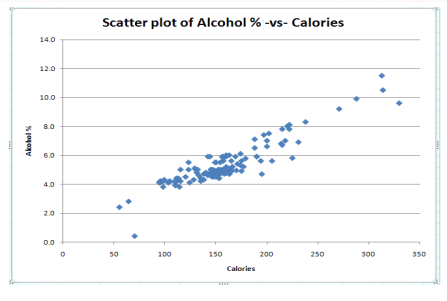
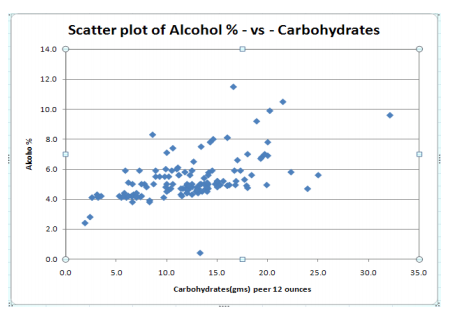
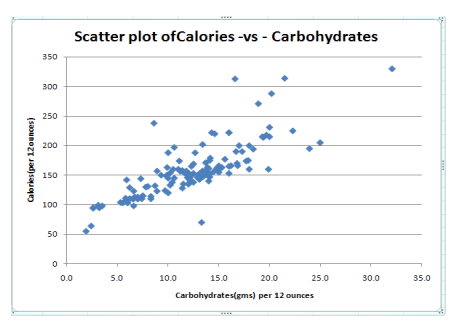
Question 5. It is necessary to analyse the relationships between percentage alcohol, number of calories per 12 ounces, and number of carbohydrates (in grams) per 12 ounces for 145 of the best selling domestic beers in the United States. The following three scatterplots give the relationships between the 3 variables.


Discuss the graphs above and what you can learn about the relationships between the pairs of variables in each graph.