Construct a scatter plot of the data minitab

Assignment Help Basic Statistics
Reference no: EM13845100

Problem 1: In class we discussed the following properties of z-scores: μZ = 0 (the mean of the Z-scores is 0) σZ = 1 (the standard deviation of the Z-scores is 1) For perfect correlation, Zx = Zy, r=1 Using the definitions of Z-score, mean, standard deviation, and correlation based on Zscore (use the equations for a population), prove these properties. For the last 2 proofs, you will need to use the additional property that Σz2 = N

Problem 2: Construct a scatter plot of the following data using Minitab:

x

y

2

3

3.5

3.5

4

5

5

3

3

3

2

4

5

4

3

2

3

5

4

4

2.5

4.5

4

3

4.5

2.5

4

3

4.5

4.5

3

4

2.5

2.5

4

2

In analyzing this data set, would you calculate a correlation coefficient? Why or why not?

Problem 3: (Montgomery 2-52)

Establishing the properties of materials is an important problem in identifying a suitable substitute for biodegradable materials in the fast-food packaging industry. Consider the following data on product density (g/cm3) and thermal conductivity K- factor (W/mK) published in Materials Research and Innovation (1999, pp.2-8)

Density (g/cm3)

Thermal Conductivity (W/mK)

0.1750

0.0480

0.0525

0.0540

0.0535

0.0570

0.0610

0.2200

0.2250

0.2260

0.2500

0.2765

(a)  Create a scatter diagram of the data in Minitab, with density as the x-variable and conductivity the y. What do you anticipate will be the sign of the correlation coefficient?

(b)  Compute the correlation coefficient (by hand or by generating a spreadsheet in Excel or another program), using whatever method you choose. Based on your answer, what type of linear relationship does the data display (strong, weak, or moderate)?

(c)   Check your answer to part b using Minitab

Problem 4: Give an example of a situation in which you might observe a very strong correlation for two variables, but no causation (like the reading level vs. shoe size example discussed in class)

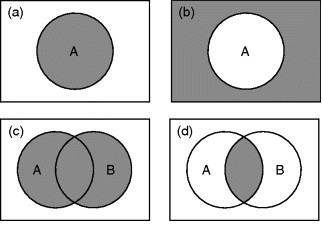
Problem 5: Venn diagrams are a useful tool for understanding sample spaces and relationships among events. Consider the following events:

A - A certain student is enrolled in CHE 445 B - That student is enrolled in CHE 472

Examine the Venn diagrams shown below. Write what situation each diagram depicts in terms of a sentence in English, and write the probability of the events represented in the diagram using the probability notation discussed in class.

2332_probability of the events.jpg

Problem 6: Use Venn diagrams to show, visually, that (A ∪ B)′ = A′ ∩ B′. Shading with different colors may be helpful.

Problem 7: Consider a fair deck of 52 cards.

(a) Draw 2 cards. Find the probability that the second card drawn will be a club. Show your work. There are two possible ways for this to happen, which we define as events A and B:

A - first card is a club, 2nd card is a club

B - first card is not a club, 2nd card is a club

(b) Starting with a newly shuffled fair deck, by using the same logic, draw 3 cards and find the probability that the 3rd card drawn will be a spade. Define the events that could lead to this outcome, and show your calculations.

(c) Based on your answers above, and your intuition, state the probability that, for a newly shuffled full deck, the 47th card drawn will be a diamond. Justify your answer.

Reference no: EM13845100

Questions Cloud

Analysis of an experience in which communication : Write a 2 page analysis of an experience in which communication with a co-worker went wrong. Diagnose the problem by describing how the parts of the communication process (sender, message received, feedback, noise) contributed to the problem
Discuss a corresponding statistical method : Describe one type of data that an HR department may process, and discuss a corresponding statistical method that may be used to summarize the data
What challenges manager face in creating a diverse workplace : What challenges do managers face in creating and managing a diverse workplace, and how might they respond to these chal lenges?
Discuss ways you can avoid the barriers : describe which factors (physiological barriers, environmental barriers, attitudinal barriers, faulty assumptions, socio-cultural differences) interfered with your listening effectiveness. Then, discuss ways you can avoid the barriers that prevent ..
Construct a scatter plot of the data minitab : Problem 2: Construct a scatter plot of the following data using Minitab:
Discuss the two basic views regarding indian tribes : What are some of the "educational considerations" successful teachers should be aware of when teaching Indian students such as cooperation vs competition. Discuss the two basic views regarding Indian tribes and the US Goverment.
What would be the emphasis in your appraisal, explain : Out of the three possible assessment targets (i.e., traits, behaviors, results) what would be the emphasis in your appraisal? Explain
Why a school violence prevention program is important : Explain why a school violence prevention program is important for today's school environment. Be sure to include whether you are focusing on high school or middle school students.
Identify relevance and faithful representation : identify relevance and faithful representation

Reviews

Write a Review

Basic Statistics Questions & Answers

  Statistics-probability assignment

MATH1550H: Assignment:  Question:  A word is selected at random from the following poem of Persian poet and mathematician Omar Khayyam (1048-1131), translated by English poet Edward Fitzgerald (1808-1883). Find the expected value of the length of th..

  What is the least number

MATH1550H: Assignment:  Question:     what is the least number of applicants that should be interviewed so as to have at least 50% chance of finding one such secretary?

  Determine the value of k

MATH1550H: Assignment:  Question:     Experience shows that X, the number of customers entering a post office during any period of time t, is a random variable the probability mass function of which is of the form

  What is the probability

MATH1550H: Assignment:Questions: (Genetics) What is the probability that at most two of the offspring are aa?

  Binomial distributions

MATH1550H: Assignment:  Questions:  Let’s assume the department of Mathematics of Trent University has 11 faculty members. For i = 0; 1; 2; 3; find pi, the probability that i of them were born on Canada Day using the binomial distributions.

  Caselet on mcdonald’s vs. burger king - waiting time

Caselet on McDonald’s vs. Burger King - Waiting time

  Generate descriptive statistics

Generate descriptive statistics. Create a stem-and-leaf plot of the data and box plot of the data.

  Sampling variability and standard error

Problems on Sampling Variability and Standard Error and Confidence Intervals

  Estimate the population mean

Estimate the population mean

  Conduct a marketing experiment

Conduct a marketing experiment in which students are to taste one of two different brands of soft drink

  Find out the probability

Find out the probability

  Linear programming models

LINEAR PROGRAMMING MODELS

Free Assignment Quote

Assured A++ Grade

Get guaranteed satisfaction & time on delivery in every assignment order you paid with us! We ensure premium quality solution document along with free turntin report!

All rights reserved! Copyrights ©2019-2020 ExpertsMind IT Educational Pvt Ltd