Reference no: EM131658786
Question 1
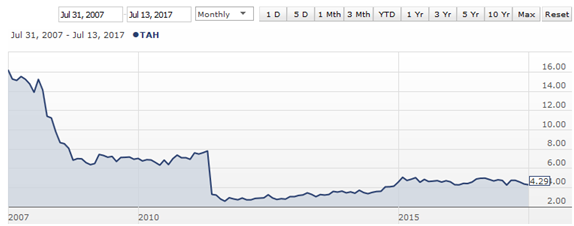
Visit the Australian Stock Exchange website, www.asx.com.au and from "Prices and research" drop-down menu, select "Company information". Type in theASX code "CWN" (Crown Resorts Limited), and find out details about the company. Also, type in the ASX code "TAH" (Tabcorp Holdings Limited), and find out the details about that company. Both these companies belong to leisure and entertainment sector. Information available in the ASX website will be inadequate for your purpose, you will need to search the internet for more information. Your task will be to get the opening prices of CWN and TAHshares for every quarter from January 2008 to July 2017 (unadjusted prices). If you are retrieving the monthly prices, read the values in the beginning of every Quarter (January, April, July, October) for every year from 2008 to 2017 (Total 39 observations, October 2017 price will not be available). To provide you with some guidance as to what the unadjusted prices look like, two chartsaccompany this question obtained from ANZ Share Investing, Australia. After you have researched share prices and leisure and entertainment sector, answer the following questions:
(a) List all the quarterly opening price values in two tables, one for CWN and the other for TAH. Then construct a stem-and-leaf display with one stem value in the middle, and CWNleaves on the right side and TAH leaves on the left side. (Must use EXCEL or similar for the plot.)
(b) Construct a relative frequency histogram for CWN and a frequency polygon for TAH on the same graph with equal class widths, the first class being "$0 to less than $2". Use two different colours for CWN and TAH. Graph must be done in EXCEL or similar software.
(c) Draw a bar chart of market capitals (or total assets) in 2016 (in million Australian dollars) of 5 companies listed in ASX that trade in leisure and entertainment (may include gaming, gambling and cinema) with over AUD500 million in market capital. Graphing must be done in EXCEL or with similar software.
(d) If one wishes to invest in CWN or TAH, what is the market recommendation (for example, from Morningstar, Fatprophets, InvestSmart, etc.)? If you cannot find the information, what would be your recommendation based on your research of these two companies?
(Note: Use only the original values of share prices and not adjusted values.)
Question 2
There are four major banks in Australia, which are Commonwealth Bank (CBA), National Australia Bank (NAB), Australia and New Zealand Banking Group (ANZ) and Westpac Bank (WBC). The following table provides the annual dividends per share for each of these banks.From the data answer the questions below for these banks. (Work only with the data provided, do not add any other data.)
|
Annual dividends per share (AUD)
|
|
Year
|
CBA
|
NAB
|
ANZ
|
WBC
|
|
2004-05
|
1.97
|
2.215
|
|
|
|
2005-06
|
2.24
|
2.474
|
1.886
|
|
|
2006-07
|
2.56
|
2.646
|
2.048
|
1.83
|
|
2007-08
|
2.66
|
2.572
|
1.478
|
1.943
|
|
2008-09
|
2.28
|
1.861
|
1.665
|
1.217
|
|
2009-10
|
2.9
|
2.048
|
1.95
|
1.895
|
|
2010-11
|
3.2
|
2.393
|
2.098
|
1.99
|
|
2011-12
|
3.34
|
2.325
|
2.183
|
2.08
|
|
2012-13
|
3.64
|
2.443
|
2.163
|
2.216
|
|
2013-14
|
4.01
|
2.105
|
2.624
|
2.433
|
|
2014-15
|
4.2
|
2.235
|
2.684
|
2.521
|
|
2015-16
|
4.2
|
2.417
|
1.934
|
2.242
|
(a) Compute the mean, median, first quartile, and third quartile of annual dividends for each bank (with only the data provided in the table, do not add or change anything in the table) using the exact position, (n+1)f, where n is the number of observations and f the relevant fraction for the quartile.
(b) Compute the standard deviation, range and coefficient of variation from the data in the table for each bank.
(c) Draw a box and whisker plot for the annual dividends of each bank and put them side by side on one graph with the same scale so that the dividends can be compared.(This graph must be done in EXCEL or similar software and cannot be hand-drawn.)
(d) Australia's financial regulator, Australian Prudential Regulation Authority, or APRA, has increased pressure on the banks on lending in recent times. Please explain what this pressure is about and how it is affecting the banks.
Question 3
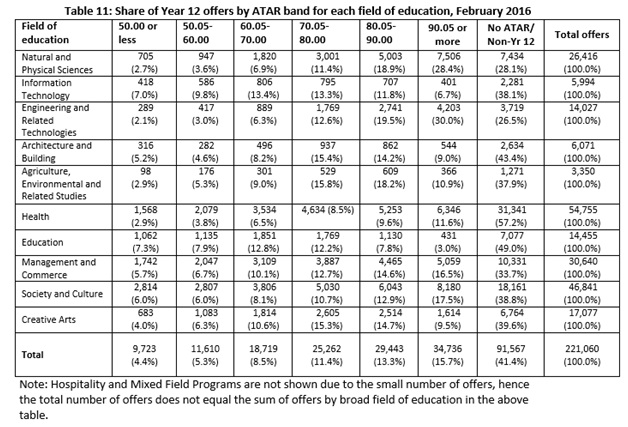
The Table below is taken from the Australian Government's Department of Education and Training. It provides data onnumber of offers made to high school graduates for admission into Australian university programs in various fields of education (discipline). Students having the best academic grade in high school would be in the ATAR band 90.05 or more, and the worst in the band 50.00 or less.
(a) Based on the proportion of offers made for different grades, which discipline is the most popular for the best students and what is that proportion?
(b) If an Australian student is selected at random, then from the table above, what is the probability that he or she is studying "Society and Culture" and had an ATAR score of 80.00 or less?
(c) Based on the proportion of offers made, which discipline has the highest proportion of students with the lowest ATAR grades, and what is that proportion?
(d) Which discipline has majority of the students from "No ATAR/Non-Yr 12" background? Please find out the reasons for that through internet searches?
Question 4
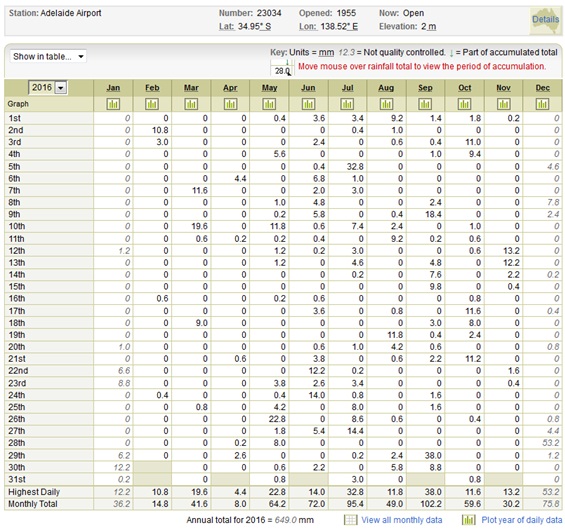
(a) The following data collected from the Australian Bureau of Meteorology Website gives the daily rainfall data (includes all forms of precipitation such as rain, drizzle, hail and snow) for the year 2016 in Adelaide, South Australia. The zero values indicate no rainfall and the left-most column gives the date. Assuming that theweekly rainfall event (number of days in a week with rainfall) follows a Poisson distribution (There are 52 weeks in a year and a week is assumed to start from Monday. The first week starts from 4 January 2016 - you are expected to visit the website and get the daily values which are not given in the table below. Part of the 52nd week runs into 2017.):
(i) What is the probability that on any given week in a year there would be no rainfall?
(ii) What is the probability that there will be 2 or more days of rainfall in a week?
(b) Assuming that the weekly total amount of rainfall (in mm) from the data provided in part (a) has a normal distribution, compute the mean and standard deviation of weekly totals.
(i) What is the probability that in a given week there will be between 8mm and 16mm of rainfall?
(ii) What is the amount of rainfall if only 12% of the weeks have that amount of rainfall or higher?
Question 5
The attached data (in Excel) is taken from the UCI machine learning data repository. The dataset is about bankruptcy prediction of Polish companies. Only a few attributes and limited number of companies have been selected from the entire table. NP/TA = Net Profit/Total Assets; TL/TA = Total Liabilities/Total Assets; WC/TA = Working Capital/Total Assets; OE/TL = Operating Expenses/Total Liabilities; PS/TS = Profit on Sales/Total Sales; TC/TS = Total Costs/Total Sales; and the last column 0 indicates not bankrupt and 1 indicates went bankrupt within a year. With using only the values provided in the table (do not bring in additional instances from the website) answer the questions below.
(a) Test for normality of all the independent variables separately using normal probability plot.(Bankruptcy status is the only dependent variable, the rest are independent variables.)
(b) Construct a 95% confidence interval for each of the variables in part (a).
(c) Test the hypothesis thatbankruptcy can be predicted using any of the independent variables. (That is, check if there is a significant difference between NP/TA of bankrupt and non-bankrupt companies. Do it for each of the other variables separately, TL/TA, WC/TA, OE/TL, PS/TS and TC/TS.) Use 5% level of significance.
Attachment:- Dataset for Question 5.xlsx