Construct a plot of the average cycle time

Assignment Help Simulation in MATLAB
Reference no: EM131478773

Question 1: Measuring cycle times of different types of jobs- Three types of jobs arrive to a process at a rate of four jobs per hour. The interarrival times are exponentially distributed. The arrivals are not equally likely for each job type. Typically 40% of the jobs are type I 35% are type II and 25% are type III. It can be assumed that all of the processing times are exponentially distributed; however the mean times depend on the job type. Table 8.3 shows the mean processing time for the activities associated with each job type. (All times are given in minutes.)

2428_Q.jpg

2142_Figure1.jpg

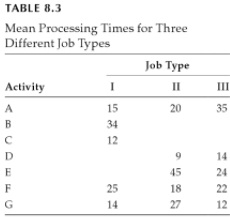
A flowchart of the process is depicted in Figure 8.65. Note that type I jobs are routed through activities B and C and job types II and III are routed through activities D and E. The percentage of rework also depends on the job type. About 5% of the type I jobs are reworked about 4% of the type II jobs are reworked and about 6% of the typeIII jobs are reworked. In terms of resources the process has three types of workers. Five super workers can handle any job; therefore managers employ them to work on activities A F or G. Three type I specialists can handle only type I jobs; therefore management employs them to work on activities B and C. Finally three type II and III specialists can handle only type II and type III jobs; therefore management employs them to work on activities D and E:
a. Develop a simulation model for this process.

b. Run the simulation for 250 h to generate approximately 1000 job arrivals and collect data on cycle times for each job type separately.
c. Assess the performance of the process based on your analysis in part (b).

Question 2: Investigating the effect of pooling resources-Three types of jobs arrive to a process at a rate that randomly varies between 2 and 4 jobs/h; that is, the interarrival times are governed by a uniform distribution with mean equal to three and a half jobs per hour.
The process is currently configured in a way such that each arrival is sent to a team of specialists according to the type of job. Each team consists of three members. A team performs three activities in order to complete each job, and any team member can work on any of the three activities (A, B, or C). Figure 8.66 shows a flowchart of the process.

811_Figure2.jpg

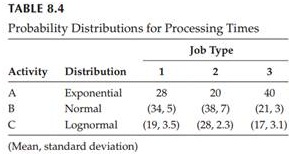
The arrivals are not equally likely for each job type. Typically, 30% of the jobs are type 1, 35% are type 2, and 35% are type 3. Processing times (in minutes) associated with the activities depend on the job type and are summarized in Table 8.4.

2277_Figure3.jpg

Management is concerned with the current performance of the process and is considering cross-training the teams so team members can work on any job type:

a. Develop a simulation model of this process that can be used to model 1 day of operation; that is, one run of the model will consist of 8 h of operation.

b. Use your model to assess performance with the following measures: cycle times, resource utilization, and overtime (the time needed to finish all jobs after the process closes). Simulate 10 days of operation to collect data for your analysis.

c. Assume that the teams are cross-trained and that all nine people can perform any of the activities in the process. Compare this design with the original process using the measures in part (b).

Question 3: Investigating the effect of rework rates-A proposed business process consists of five serial workstations. One caseworker is positioned in each workstation. The processing times at each workstation are exponentially distributed with mean values of 11, 10, 11, 11, and 12 min, respectively. The interarrival times are uniformly distributed between 13 and 15 min. The workstations have an unlimited queuing capacity, and it is assumed that the downstream transfer time is negligible. The unique aspect of this process is that between workstations 2 and 5, it is possible that the job will need to be reprocessed by the workstation immediately preceding the current one. For example, after workstation 3, it is possible that the job will be sent back to the queue in workstation 2. When this occurs, the transfer requires 3 min. The probability of rework remains the same regardless of the number of times a job is sent back for reprocessing. The rework probability is considered to be the same for all workstations and is currently estimated to be between 5% and 10%:

a. Develop a simulation model of this process that is capable of running 10,000 min of operation.

b. Run 10,000 min of operation for rework probabilities of 5%, 6%, 7%, 8%, 9%, and 10%. Collect cycle time data for each run.

c. Construct a plot of the average cycle time (y-axis) versus the rework probability (x-axis). Also construct a plot of the maximum cycle time versus the rework probability.

d. Assume that the processing times are constant. Run the simulation six times with the rework probabilities in part (b).

e. Construct plots of average cycle time and maximum cycle time versus the rework probability. Compare these plots with the ones obtained in part (c).

Verified Expert

This task involves specific calculations and creation of network specifications and model. Three tasks were der and it involved modeling calculations. It also involves probability calculations and creation of network model based on job scheduling. The cases were given as pet modeling

Reference no: EM131478773

Questions Cloud

Develop the segmentation-targeting and positioning strategy : Put yourself in the position of an entrepreneur who is developing a new product or service to introduce into the market. Briefly describe the product.
How does educational attainment vary across states : How does educational attainment vary across states? How well do U.S. students perform today compared to the past in math, science, and reading?
Find relationship between wheat and marginal product : Home produces two goods, computers and wheat, for which capital is specific to computers, land is specific to wheat, and labor is mobile between the two.
Conduct and in-depth interview for two respondents : Conduct and in-depth interview for two respondents about how they go through each stage of their purchase decision-making process.
Construct a plot of the average cycle time : Construct a plot of the average cycle time (y-axis) versus the rework probability (x-axis). Also construct a plot of the maximum cycle time versus the rework probability
Draw the production possibilities frontier for home : Similar to Home in Problem, Foreign also produces computers and wheat using capital, which is specific to computers; land, which is specific to wheat.
How much the athlete is being paid to endorse the product : Product the athlete is endorsing. Ways in which the athlete is endorsing the product.
Explain the competitive pressures that are present in market : Discuss the effect of international trade on each market structure. Explain the competitive pressures that are present in markets with high barriers to entry.
What are the equilibrium quantity and equilibrium price : What are the equilibrium quantity and equilibrium price? How much consumer surplus exists in this market? What will the consumer surplus be after the tax?

Reviews

Write a Review

Simulation in MATLAB Questions & Answers

  Simulate the CSTR described in example

For part 2 you need to determine the PI parameters, Kc and tI, using any one of the tuning methods covered in this course

  Discuss the direction of the phase plot

In a separate cell (called Summary Cell) - Discuss the direction of the phase plot with respect to its starting point, where the pulse turns off and at its final value

  Write and implement a matlab program to apply 3 x 3 mask

Write and implement a matlab program to apply 3 x 3 mask

  Build a simulation model to model given process

uild a simulation model in SIMUL8 to model this process. Find the average total time each type of customer spends in the system, as well as the number of balks. Also, find the maximum length of each queue, and both server utilisations.

  Find z-transform for time domain signal using matlab

EECE 365 Signals, Systems & Transforms. Find z-Transform for following time domain signal using MATLAB. Consider using sym function to define time domain signal

  Create and use at least one loop in function

Make a main m-file that you use to run and call your function file. Give it a unique name. Make sure and include your name, your section, and date at the top of the m-file. Create and use at least one loop (for/while/midpoint), Create and use at l..

  Build a simulation using newtons laws of motion

Build a new and different simulation of your own using Newtons laws of motion and Show the code and describe how it works

  Simulate the given circuit using matlab or any software

Simulate the circuit using Matlab or any software of preference

  Compute value of k when the root locus cross imaginary axis

analytically determine the value of K when the root locus cross the imaginary axis for each case. You should hand sketch root locus but you may check your work.

  Create a simulink model for the scara robot depicted

Create a Simulink Model for the SCARA robot depicted - The motor specification is appended to this brief - create a subsystem to model the motors taking into account that the inertia of Arms 1 and 2 combined is not a constant but depends upon the..

  Queuing simulator

Queuing Simulator: Consider a communications router that can route (service) EXACTLY 800 messages per second (mps). Assume that messages arrive at an AVERAGE rate of 850 messages per second. Assume that the arriving messages follow an exponential dis..

  How can you get the amplitude and phase response

Given a complex system transfer function H(w)=Re(H(w))+jlm(H(w)). How can you get its amplitude and phase response? Suppose a system transfer function H(w) has a phase function of p(w), which is unwrapped.

Free Assignment Quote

Assured A++ Grade

Get guaranteed satisfaction & time on delivery in every assignment order you paid with us! We ensure premium quality solution document along with free turntin report!

All rights reserved! Copyrights ©2019-2020 ExpertsMind IT Educational Pvt Ltd