Construct a normal quantile plot

Assignment Help Basic Statistics
Reference no: EM132337993

Inferences on 2 Means - Paired Samples Assignment -

Q1. A reading teacher claims that a reading course will increase students' reading speeds. The table below shows reading speeds for 8 students before and after the reading course.

Student

1

2

3

4

5

6

7

8

Before

250

500

450

310

640

200

350

400

After

375

550

425

400

650

280

375

390

Difference d = Before - After


At α = 0.05, is there enough evidence to conclude that the course increases reading speed?

If the course actually increases reading speed, then the reading speed is greater after than before, and the difference, d = Before - After will be negative. The hypotheses are

H0: μd = 0

H1: μd < 0

(a) Complete the table above by calculating the differences in reading speeds.

(b) Construct a normal quantile plot (Sec 6.5) and a box plot for the paired differences. Make rough sketches of the two plots. Is it reasonable to use the paired T-test?

(c) Use STAT/CALC 1: 1-Var Stat to find the mean and standard deviation of the differences:

d-

sd


(d) You will test the hypotheses using a T-Test on the differences. First, give the value of the test statistic.

(e) Then give the P-value.

(f) State your decision (reject the null hypothesis or fail to reject the null hypothesis).

(g) State your conclusion.

(h) Use the TInterval procedure on your calculator to construct a 95% confidence interval for the mean difference in reading speeds. Then interpret the CI using the template on the notes page (remember the 2nd sentence!)

Q2. To test the belief that sons are taller than their fathers, a student randomly selects 13 fathers who have adult male children. She records the height of both the father and son in inches and gets the following data.


1

2

3

4

5

6

7

8

9

10

11

12

13

Ht of Father, Xi

70.3

67.1

70.9

66.8

72.8

70.4

71.8

70.1

69.9

70.8

70.2

70.4

72.4

Ht of Son, Yi

74.1

69.2

66.9

69.2

68.9

70.2

70.4

69.3

75.8

72.3

69.2

68.6

73.9

Are sons taller than their fathers?

(a) Complete the list of paired differences d = Xi - Yi in the table below.

1

2

3

4

5

6

7

8

9

10

11

12

13

-3.8

-2.1


(b) State the null and alternative hypotheses in terms of the mean difference, μd. (Remember that, if the son is taller than the father, d will be negative.)

(c) Use the T-test on the paired differences. Give the value of the test statistic.

(d) Give the P-value.

(e) State your decision at the α = 0.05 level.

(f) State your conclusion.

(g) Use the TInterval procedure on your calculator to find a 90% confidence interval for the mean difference in height.

(h) Interpret this confidence interval.

Q3. Interpret calculator display: The following TI-84 Plus calculator display presents the results of a hypothesis test for the mean difference between matched pairs.

978_figure.png

a. Is this a left-tailed test, a right-tailed test, or a two-tailed test?

b. How many degrees of freedom are there?

c. What is the P-value?

d. What is the decision at the 0.05 level? Explain.

Q4. Interpret calculator display: The following TI-84 Plus calculator display presents a 99% confidence interval for the mean difference between matched pairs.

1364_figure1.png

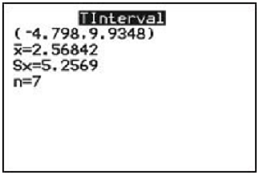
a. What is the point estimate of μd?

b. How many degrees of freedom are there?

c. Fill in the blanks: We are 99% confident that the mean difference is between _____________ and _________________.

Reference no: EM132337993

Questions Cloud

Define what benefits do you reap from your social network : What benefits do you reap from your social network? Are these benefits economic, social, and/or psychological? Use 250 Words. The response must be typed.
Evaluate the impact of introducing an e-commerce system : BTEC Level 5 HND Computing and Systems Development-Business Skills for E-Commerce-ULKOM BICYCLE HIRE -
Discuss problem beased on al vernacchio speech about sex : Give your opinion on Al Vernacchio speech about sex needing a new metaphor. Do you agree or disagree? No less than 250 words. Must also respond to at least.
How was your compassion demonstrated : Reflect on a caring and compassionate experience with a patient or family encountered in your practice. How was your compassion demonstrated?
Construct a normal quantile plot : Inferences on 2 Means - Paired Samples Assignment - Construct a normal quantile plot (Sec 6.5) and a box plot for the paired differences
What impact did an undescended testicle have : At semester break, this young man underwent right orchiectomy. Pathology was compatible with embryonal cell carcinoma. CT directed biopsy of the most prominent.
Make necessary refinements to the strategic plan : Discuss how continuous improvement is used to make necessary refinements to the strategic plan.
Performance metrics used to review a strategic plan : Briefly discuss what are the performance metrics used to review a strategic plan?
Make for sustaining innovation in the marketplace : What recommendations should Amazon CEO make for sustaining innovation in the marketplace?

Reviews

Write a Review

Basic Statistics Questions & Answers

  Determine what the advertised contents should be

Return to the example of Machine 2 in the shampoo bottle problem. Assume that management likewise wishes to ensure that the advertised contents.

  Hypothesis test of difference between two means

Hypothesis test of difference between two means based on independent random samples, which one of the given is correct rejection region at significance level of .05?

  Compare the two histograms

The histograms show the distribution of the percentages of graduates who, 9 months after graduating, have obtained jobs that require a law degree.

  Benefit of transforming data from the distribution

When comparing data from different distributions, what is the benefit of transforming data from these distributions to conform to the standard distribution?

  What two iq scores separate extreme 1 percent of population

What two IQ scores separate the extreme 1 percent of the population from the middle 99 percent? Set this problem up using the "extreme 5 percent" example as a model.

  Identify a peer-reviewed journal article health based

identify a peer-reviewed journal article health based published in the last 5 years that uses the poisson distribution.

  Test scores have a stadard deviation of 18 and a mean of 69

test scores have a stadard deviation of 18 and a mean of 69. if at random 49 test scores are picked what is the

  Find and sketch the probability density function

Find and sketch the probability density function of ? = tan-1 (Y/X) if X and Yare independent random variables, each normally distributed with mean 0

  Solve problem-heights of young adults

The mean height of men aged 18 to 24 is about 70 inches. Women that age have a mean height of about 65 inches. Do you think that the distribution of heights.

  Find the probability about the overweight children

Without doing any calculations, determine whether this probability is greater than 50% or if it is less than 50%. Explain.

  You want to test the effects of water aerobics on resting

you want to test the effects of water aerobics on resting heart rate. you decide to test two different levels of

  Describe sample space for outcome of a visit to web page

A user of the page can click on one of the links or he or she can leave that page. Describe the sample space for the outcome of a visit to your Web page.

Free Assignment Quote

Assured A++ Grade

Get guaranteed satisfaction & time on delivery in every assignment order you paid with us! We ensure premium quality solution document along with free turntin report!

All rights reserved! Copyrights ©2019-2020 ExpertsMind IT Educational Pvt Ltd